What you need to know about your energy bill and the cap

Izabel Bahia Published on 12th August 2022

As millions of UK households worry about growing energy bills ministers meet with energy bosses today to discuss measures to tackle the cost of living crisis. The energy price cap continues its rise from £1,977 in April to an expected £3,500 in October and an astronomical £4,200 in January. In this blog post Izabel Bahia breaks down the drivers of energy bills to highlight where the government can act.
Understanding what makes up an energy bill prompts us to reconsider how fuel poverty is defined and can inspire new policy solutions that create lasting change for the households struggling to meet their energy costs.
Next week we will publish policy proposals we think the government should consider to best support low-income households, and share practical actions councils are taking to support their residents. Subscribe to our blog to automatically get this post via email.
Deven Ghelani spoke on GB News about the impact of the energy crisis on families, measures that could help, and how they could be funded. Click image to listen back
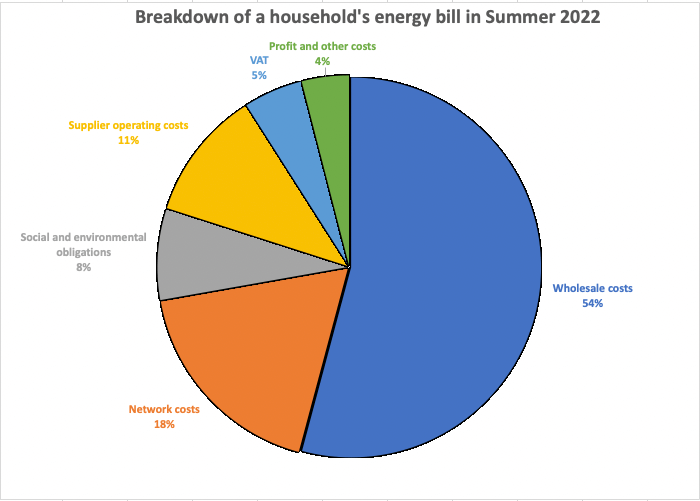
How energy bills are calculated and why they are so high
Historically high wholesale energy prices are a key driver of soaring energy bills. In January 2020, wholesale costs made up 36% of energy bills. Today nearly 55% of your energy bill goes to cover the costs of buying energy in international markets. These costs continue to rise as the war in Ukraine draws out, and demand across the globe increases.
Unfavourable market forces are only a part of the equation. Lack of investment in energy efficiency and poor regulation have created the perfect conditions for the current energy crisis.
The UK has been hit particularly hard because our homes are among the least energy efficient in Europe. Current efforts to boost energy efficiency need to be rolled out faster. Investment in energy-efficient homes could reduce consumption by as much as 25% and save consumers £270 a year on energy. Energy efficiency policies are necessary to meet net zero goals, reduce dependency on fossil fuel imports and improve the UK’s energy security.
Poor regulation also impacts household energy bills. In a letter to Ofgem, Fuel Poverty Action said that consumers are being unfairly charged. The charity estimates that £68 of the £75 annual increase in the standing charge is due to ‘negligent policymaking’ to cover the costs of badly-run energy companies that went bust over the last year.
The energy price cap: an insufficient solution to reducing energy bills
Your energy bill is not the energy price cap. The cap was introduced in 2019 to protect households from expensive tariffs. It limits how much your supplier can charge you for each unit of electricity or gas.
There is also a standing charge that covers the costs that suppliers incur to maintain energy networks, carry out meter readings, support vulnerable households and meet government initiatives to reduce CO2 emissions.
You pay the standing charge whether or not you use any fuel. This means that low-income households are impacted by rising energy bills even if they use very little fuel. Between October 2021 and April 2022, the standing charge for gas and electricity increased from 51p to 75p a day.
The price cap used to be revised twice a year, in April and October. It increased by 9% in the spring of 2021, 12% in the following autumn and 54% in April 2022. This means that energy bills will have increased by 108% in the last 12 months.
Last week, Ofgem confirmed that the energy price cap will be updated every three months. Whilst this means that prices can rise more quickly, the regulator defends the decision by saying it will means bills can be adjusted downwards more rapidly when wholesale prices fall.
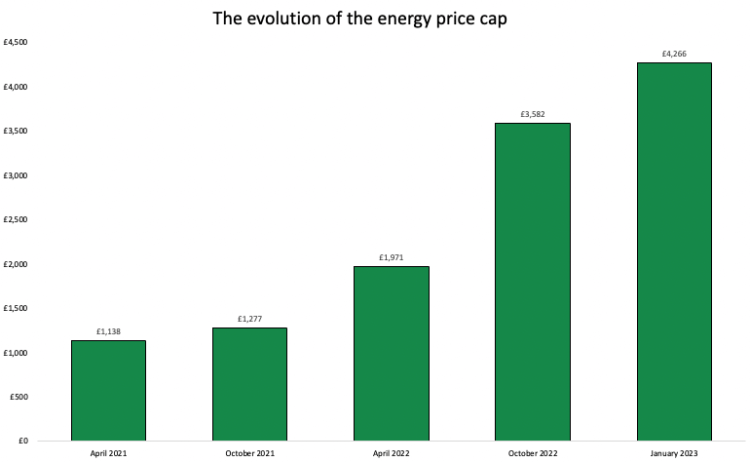
October’s price cap is due to be announced at the end of August, but the annual average energy bill is forecast to hit £3,582 in the autumn and £4,266 in January. The energy charity National Energy Action predicts that 8.8 million households will be in fuel poverty by the end of 2022. The price cap leaves out many rural homeowners who rely on oil for heating their homes, households that are likely to be more heavily impacted by other price increases too.
How tariffs and meters affect how much you pay
Your energy bill is heavily influenced by tariffs and how you pay your bill. Energy suppliers have two types of tariffs, a fixed tariff and a default or standard tariff.
When customers are offered a fixed tariff they enter a contract with their energy supplier to keep their tariff fixed for a set period of time, normally one or two years.
A default or standard tariff is the basic tariff an energy supplier offers. You tend to be put on a default tariff if you haven’t chosen an energy tariff, for example:
- when moving to a new property
- when a fixed term contract ends and you’re not offered a new fixed arrangement
- if your supplier goes bust and Ofgem appoints you a new supplier
The price cap applies to default or standard tariffs and prepayment meters only.
Prepayment meters can help people to manage their household budgets, but it is the most expensive way to pay for your energy. People will have prepayment meters if they move to a house where one is already installed and they can’t pass credit checks, or because their supplier has forcefully changed their meter.
All households have been hit hard by rising energy prices but it is those families on prepayment meters who are the first to struggle to keep their homes warm. About 4.5 million people in the UK have a prepayment meter, more than half of whom earn less than £18,000 a year.
This ‘poverty premium’ means that customers on lower incomes pay more for the energy they use than people who pay through direct debit. They are the first to feel the consequences of rising prices as they pay for energy on a day-to-day basis.
At the start of April, the average bill paid by customers on standard tariffs rose by £693 to £1,971 a year. For prepayment meter customers the increase was 2% higher, up by £708 to £2,017.
Three things to know about your energy bill and the cost of living crisis
By understanding the components of an energy bill households can see that:
- The energy cap doesn’t limit your total bill, this depends on how much energy you use
- Most people are better off staying on a default or standard tariff (but contact Citizens Advice or your supplier for detailed advice)
- If you are on a prepayment meter be aware that you will pay more than you would if you pay by direct debit
If you are struggling to afford your energy bill, you can contact your Council and your local Citizens Advice to find out about discretionary support and access to the Household Support Fund.
The DWP’s statistics on benefit take-up show that £15 billion of support is unclaimed each year. Policy in Practice’s Better Off Calculator can help people to find out what support they are eligible for and how to claim. See www.betteroffcalculator.co.uk for a free calculation.
Identifying and supporting households that are fuel poor
For local authorities and policymakers, understanding how energy bills are calculated should prompt a further discussion on the measurement and identification of fuel poverty.
The problem with the current definition of fuel poverty in England is that it assumes that anyone living in a house with an Energy Performance Certificate (EPC) rating above C is not fuel poor. Yet, in reality, household net income plays a more important role in establishing who is fuel poor.
Fuel poverty measurements vary across the nations. In England, households are considered to be in fuel poverty if they:
- Live in a property with an EPC rating band of below C
- Have a disposable income (income after housing costs and energy needs) below the official poverty line
In Scotland and Wales, for example, EPC rating is not part of the definition of fuel poverty. EPC measures how energy efficient a house is, based on a grading system between A and G. The UK Government has set targets to ensure that homes in the UK are EPC C or above, but the average EPC score in England and Wales is D. Research conducted by the Open Property Group found that 40% of homes in England are not currently meeting the Energy Standards. This means that a lot of energy is wasted by outdated equipment and poorly insulated homes.
Boosting energy efficiency is an essential, long-term reform. The UK has extremely low energy efficient homes in comparison to the rest of Europe, and there is insufficient support out there for households to make their homes more energy efficient.
Policy in Practice helps councils to identify and target individual households most in need of support using their administrative data. Around 40 leading local authorities can use the Low Income Family Tracker (LIFT) to identify households who are in fuel poverty now.
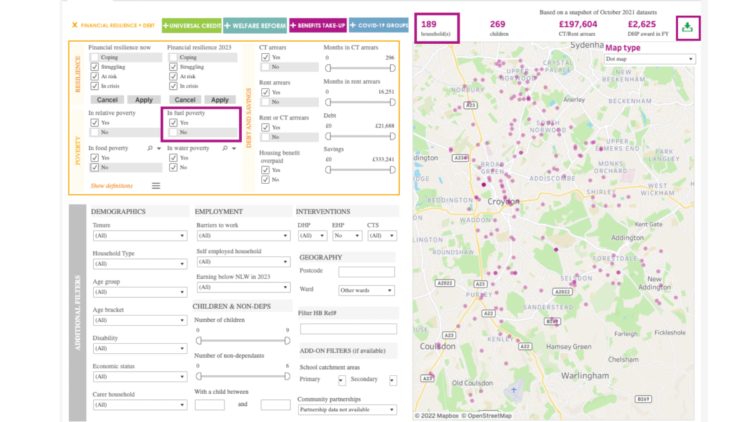
Councils who analyse their administrative data in this way are best placed to quickly identify and target support to the most vulnerable households when support, such as the £500 million Household Support Fund, is released by the government.
Thinking long-term: how to protect consumers
The energy price cap and the measures announced by the Chancellor in May are welcome. However, the long-term root of the problem is the lack of investment in energy efficiency, dependency on international markets and fossil fuels, and the gap in income, particularly for vulnerable households.
The industry and consumers face incredible uncertainty. It is hard to predict what the UK energy market will look like in two to five years. One-off payments cannot address those problems or give investors and people the confidence they need to move forward. Both a clear path to energy efficiency and a social tariff for vulnerable households are urgently needed to protect consumers and businesses in the long term.

 Book a Call


Exploring the potential of administrative benefits data to evaluate the impact of legal services