What’s so rapid about RAPID?

Kate Collins Published on 11th September 2024

Data and insight into poverty metrics and living standards in the UK are out of date on the day they are published.
In March 2024, the DWP released its latest Households Below Average Income (HBAI) statistics making headlines around the UK with findings such as a ten year high in levels of hardship and some 3.6 million children living in absolute poverty.
The HBAI statistics provide the official picture of UK living standards and are based on information on household income, expenditure, and circumstances collected as part of the Family Resources Survey (FRS), providing a representative sample of private households in the UK. It takes time to process the data from the FRS and turn it into meaningful results – around a year in fact.
The most recent HBAI figures cover twelve months to March 2023 only, meaning that the latest official statistics on rates of low income and poverty in the UK are already more than a year out of date. Since March of 2023, we have had two Spring Budgets and one Autumn Statement with significant policy changes impacting income and poverty levels, such as uprating Local Housing Allowance, as well as a continued high rate of inflation taking housing and fuel prices to new highs.
The reasons for the gap between FRS data collection and the publication of the official HBAI figures are clear and valid. The HBAI and the data it is drawn from undergo extensive processing, manipulation and quality checking, all of which take time. For these reasons, the HBAI remains the gold standard for information about living standards in the UK, but there is considerable need for more up-to-date data to stand alongside the HBAI reports.
The Joseph Rowntree Foundation and Policy in Practice have developed a tool that aims to fill in some of the missing data by providing information on levels of low income and poverty with a one month, rather than one year, lag. We have called it RAPID, short for Real-time Analysis of Poverty Indicators Dashboard, because the information it contains is just that – rapid.
As a pilot project, RAPID provides up to date data on living standards in London amongst households claiming benefits, allowing for a more immediate view of trends across the capital. Access to an up to date view of low income and poverty rates among some of the most financially precarious in society is crucial for identifying the impact of policy responses to the cost of living crisis. We hope to learn from this pilot to expand RAPID beyond London across the wider UK.
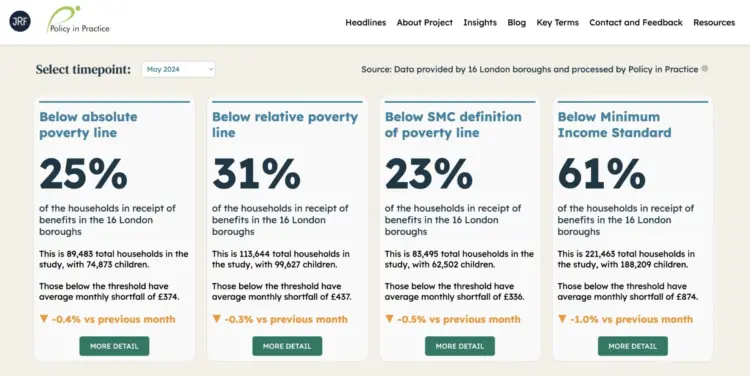
RAPID gives monthly updates on rates of poverty and low living standards across four key metrics
Is administrative data the key to poverty metrics?
RAPID’s speed does not mean that we cut corners when it comes to data quality or skip the kind of processing undergone by the standard F.R.S. data that feeds into the HBAI. The ability to provide information on living standards with only a month’s lag is rather because RAPID works by using a different source of data to the HBAI. Rather than using the survey data collected in the FRS, we make use of an innovative administrative data source that is updated each month, rather than each year.
Administrative data is data that is generated whenever people interact with public services, and in the case of RAPID, we use the data generated when households interact with local authorities to claim locally administered benefits such as Housing Benefit or Council Tax Reduction. RAPID also draws on data received by local authorities about households in their area in receipt of Universal Credit, where such data is available.
Policy in Practice has access to this administrative data generated during the benefits award process for local authorities nationally as part of our Low Income Family Tracker (LIFT) platform. We use this data for benefit take up purposes using the legal gateways provided through GDPR and other data protection regulations. These datasets are updated every month. Feeding this information into Policy in Practice’s policy engine provides monthly snapshots of levels of poverty and low income in the capital.
The data within RAPID comes from London boroughs only, as this is a region where Policy in Practice has a concentrated number of local authorities using LIFT and providing us with benefits administrative data. These London clients include boroughs in inner and outer London, while also including more and less affluent areas. This wide ranging coverage makes London a good place to test RAPID.
One possible drawback of focusing on London is that living costs in the capital are not representative of national living standards. But RAPID aims to show the potential administrative data has to transform poverty measurement, rather than providing a country-wide snapshot. We would be very interested in extending the project to other regions in the future.
We use this kind of administrative data held by many London boroughs as it contains information about the circumstances, incomings, and certain outgoings for households claiming local benefits. We use this data for benefit take up purposes using legal gateways provided through GDPR. These datasets are updated every month.
The administrative data used by RAPID covers a subset of the population: households who receive Housing Benefit and/or Council Tax Support and/or Universal Credit. We can assume however that these households are more likely to be in poverty and on a low income. We do not aim to replicate the HBAI statistics but complement them by providing more up to date estimates. Around 23% of the total population of the participating boroughs is present in the administrative datasets that RAPID uses.
RAPID’s use of administrative data contrasts with the survey data used to produce the annual HBAI figures, along with many other poverty measurements. Survey data often involves self-reporting, which can produce unreliability as people may under report things such as expenditure. Care must also be taken to ensure that those surveyed are representative of the wider population of interest.
Administrative data, on the other hand, is wider and deeper in terms of detail and variables and reports actual not self reported figures for things like income and costs. At the same time, however, the administrative data used here does not cover the whole London population, only those households in receipt of benefits.
This project is a joint effort between the Joseph Rowntree Foundation and Policy in Practice. The Joseph Rowntree Foundation is an independent social change foundation and charity focussed on ending poverty in the United Kingdom, while Policy in Practice is a social policy software and analytics firm which makes use of data in innovative ways to maximise income, deliver social policy insight, and drive change.
RAPID is an ongoing project, and we welcome any feedback you have on the tool and the data it contains. We would especially love to know any ideas you have for how you can use the dashboard in your organisation. We have a feedback form for general comments, suggestions for improvement, and potential use cases available here.


