Pension Credit
Over 850,000 eligible pensioners are missing out on Pension Credit
Deven Ghelani speaks to Felicity Hannah on BBC’s Wake up to Money about the removal of the Winter Fuel Payment for pensioners not on Pension Credit
Unclaimed Pension Credit
Unclaimed Pension Credit by local authority area
| Authority | Pension Credit amount | Pension Credit households |
|---|---|---|
| Amber Valley | £3,376,639 | 1,507 |
| Derbyshire Dales | £1,505,161 | 674 |
| Erewash | £2,788,509 | 1,378 |
| High Peak | £2,223,591 | 1,002 |
| North East Derbyshire | £3,086,764 | 1,413 |
| South Derbyshire | £2,098,556 | 961 |
| Blaby | £2,292,972 | 951 |
| Charnwood | £4,000,405 | 1,670 |
| Harborough | £1,640,458 | 739 |
| Hinckley and Bosworth | £2,150,103 | 1,061 |
| Melton | £1,030,655 | 465 |
| North West Leicestershire | £2,001,031 | 941 |
| Oadby and Wigston | £1,660,575 | 637 |
| Boston | £2,914,474 | 1,083 |
| East Lindsey | £6,471,367 | 2,843 |
| Lincoln | £2,931,704 | 1,240 |
| North Kesteven | £2,828,905 | 1,292 |
| South Holland | £2,773,545 | 1,258 |
| South Kesteven | £3,264,673 | 1,432 |
| West Lindsey | £2,588,090 | 1,176 |
| Derby | £9,259,570 | 3,294 |
| Leicester | £23,899,029 | 5,997 |
| North Northamptonshire | £8,660,891 | 3,667 |
| Nottingham | £11,556,056 | 4,261 |
| Rutland | £671,583 | 303 |
| West Northamptonshire | £9,771,550 | 3,774 |
| Ashfield | £3,476,892 | 1,606 |
| Broxtowe | £2,620,475 | 1,192 |
| Gedling | £2,648,867 | 1,205 |
| Mansfield | £3,139,547 | 1,357 |
| Newark and Sherwood | £3,065,549 | 1,355 |
| Rushcliffe | £2,094,285 | 926 |
| Bassetlaw | £3,441,009 | 1,498 |
| Bolsover | £2,631,774 | 1,162 |
| Chesterfield | £3,621,617 | 1,623 |
| Cambridge | £2,701,059 | 909 |
| East Cambridgeshire | £1,818,368 | 749 |
| Fenland | £3,543,331 | 1,499 |
| Huntingdonshire | £3,288,827 | 1,382 |
| Peterborough | £7,482,671 | 2,489 |
| South Cambridgeshire | £2,801,690 | 1,053 |
| Basildon | £5,517,859 | 2,201 |
| Braintree | £3,397,223 | 1,546 |
| Brentwood | £1,724,095 | 662 |
| Castle Point | £2,860,701 | 1,215 |
| Chelmsford | £3,503,477 | 1,393 |
| Colchester | £4,419,299 | 1,686 |
| Epping Forest | £4,037,662 | 1,482 |
| Harlow | £2,511,164 | 991 |
| Maldon | £1,687,340 | 751 |
| Rochford | £1,907,227 | 849 |
| Tendring | £6,759,182 | 2,868 |
| Uttlesford | £1,534,400 | 661 |
| Broxbourne | £2,890,981 | 1,042 |
| Dacorum | £3,148,677 | 1,212 |
| East Hertfordshire | £2,673,503 | 1,041 |
| Hertsmere | £3,142,548 | 1,053 |
| North Hertfordshire | £2,595,942 | 1,105 |
| St Albans | £2,363,361 | 847 |
| Stevenage | £2,230,157 | 861 |
| Three Rivers | £2,203,773 | 751 |
| Watford | £2,606,782 | 829 |
| Welwyn Hatfield | £2,659,214 | 963 |
| Bedford | £4,764,014 | 1,696 |
| Central Bedfordshire | £5,094,596 | 2,195 |
| Luton | £8,453,489 | 2,583 |
| Southend-on-Sea | £6,418,562 | 2,509 |
| Thurrock | £4,740,211 | 1,711 |
| Breckland | £3,918,728 | 1,767 |
| Broadland | £2,765,096 | 1,311 |
| Great Yarmouth | £4,247,410 | 1,910 |
| King's Lynn and West Norfolk | £5,027,994 | 2,218 |
| North Norfolk | £3,292,751 | 1,594 |
| Norwich | £4,638,824 | 1,921 |
| South Norfolk | £3,253,128 | 1,427 |
| Babergh | £2,129,341 | 975 |
| East Suffolk | £6,770,160 | 3,110 |
| Ipswich | £4,309,781 | 1,592 |
| Mid Suffolk | £2,169,053 | 963 |
| West Suffolk | £3,855,444 | 1,720 |
| Barking and Dagenham | £9,878,783 | 2,671 |
| Barnet | £19,531,396 | 4,689 |
| Bexley | £6,981,110 | 2,317 |
| Brent | £23,546,686 | 5,334 |
| Bromley | £8,971,948 | 2,908 |
| Camden | £13,968,729 | 3,621 |
| City of London | £204,712 | 59 |
| Croydon | £15,092,043 | 4,188 |
| Ealing | £23,990,350 | 5,164 |
| Enfield | £18,362,599 | 4,710 |
| Greenwich | £13,722,012 | 3,637 |
| Hackney | £17,494,311 | 4,408 |
| Hammersmith and Fulham | £10,530,298 | 2,676 |
| Haringey | £16,936,004 | 4,136 |
| Harrow | £16,033,233 | 3,350 |
| Havering | £7,625,701 | 2,606 |
| Hillingdon | £13,334,591 | 3,147 |
| Hounslow | £15,805,288 | 3,510 |
| Islington | £12,945,916 | 3,570 |
| Kensington and Chelsea | £10,156,355 | 2,555 |
| Kingston upon Thames | £5,965,566 | 1,449 |
| Lambeth | £16,034,769 | 4,405 |
| Lewisham | £12,669,862 | 3,682 |
| Merton | £8,090,878 | 2,058 |
| Newham | £20,553,330 | 4,832 |
| Redbridge | £14,989,691 | 3,684 |
| Richmond upon Thames | £5,500,188 | 1,592 |
| Southwark | £16,027,522 | 4,395 |
| Sutton | £6,478,990 | 1,852 |
| Tower Hamlets | £16,891,355 | 4,304 |
| Waltham Forest | £12,175,709 | 3,361 |
| Wandsworth | £12,416,028 | 3,356 |
| Westminster | £15,382,813 | 3,524 |
| County Durham | £19,811,765 | 8,862 |
| Gateshead | £7,923,577 | 3,457 |
| South Tyneside | £6,655,381 | 3,042 |
| Sunderland | £12,247,384 | 5,551 |
| Newcastle upon Tyne | £11,396,174 | 4,429 |
| North Tyneside | £6,831,280 | 3,168 |
| Northumberland | £9,049,241 | 4,314 |
| Darlington | £3,665,865 | 1,535 |
| Hartlepool | £4,502,208 | 1,917 |
| Middlesbrough | £6,036,758 | 2,430 |
| Redcar and Cleveland | £5,420,818 | 2,524 |
| Stockton-on-Tees | £6,287,307 | 2,699 |
| Bolton | £12,034,358 | 4,374 |
| Bury | £5,922,232 | 2,357 |
| Manchester | £26,376,411 | 8,175 |
| Oldham | £8,538,229 | 3,278 |
| Rochdale | £8,452,711 | 3,381 |
| Salford | £9,465,736 | 3,741 |
| Stockport | £8,388,227 | 3,366 |
| Tameside | £7,612,552 | 3,276 |
| Trafford | £6,653,919 | 2,487 |
| Wigan | £9,558,492 | 4,425 |
| Burnley | £3,419,469 | 1,411 |
| Chorley | £2,518,230 | 1,170 |
| Fylde | £2,654,743 | 1,145 |
| Hyndburn | £2,923,097 | 1,247 |
| Lancaster | £4,267,500 | 1,836 |
| Pendle | £4,032,337 | 1,471 |
| Preston | £4,905,914 | 1,869 |
| Ribble Valley | £1,038,154 | 482 |
| Rossendale | £2,164,966 | 967 |
| South Ribble | £2,322,038 | 1,078 |
| West Lancashire | £3,594,915 | 1,630 |
| Wyre | £4,150,192 | 1,786 |
| Halton | £4,740,963 | 2,024 |
| Knowsley | £8,171,963 | 3,321 |
| Liverpool | £26,836,566 | 10,065 |
| Sefton | £11,437,437 | 4,957 |
| St. Helens | £6,468,414 | 2,791 |
| Wirral | £12,854,913 | 5,282 |
| Cumberland | £7,680,576 | 3,480 |
| Westmorland and Furness | £5,467,363 | 2,450 |
| Blackburn with Darwen | £6,509,893 | 2,273 |
| Blackpool | £7,304,769 | 3,112 |
| Cheshire East | £8,044,425 | 3,470 |
| Cheshire West and Chester | £8,787,095 | 3,874 |
| Eden | ||
| South Lakeland | ||
| Warrington | £5,157,220 | 2,236 |
| Eastbourne | £4,314,480 | 1,643 |
| Hastings | £4,510,955 | 1,716 |
| Lewes | £3,022,683 | 1,244 |
| Rother | £3,514,951 | 1,459 |
| Wealden | £3,787,119 | 1,619 |
| Basingstoke and Deane | £3,660,458 | 1,273 |
| East Hampshire | £2,286,394 | 918 |
| Eastleigh | £2,381,305 | 1,018 |
| Fareham | £1,976,691 | 906 |
| Gosport | £1,968,833 | 910 |
| Hart | £1,388,860 | 522 |
| Havant | £3,796,378 | 1,657 |
| New Forest | £4,332,062 | 1,870 |
| Rushmoor | £6,721,314 | 1,376 |
| Test Valley | £2,391,077 | 965 |
| Winchester | £2,395,946 | 968 |
| Ashford | £4,913,404 | 1,519 |
| Canterbury | £4,620,791 | 1,821 |
| Dartford | £2,238,801 | 839 |
| Dover | £3,804,230 | 1,590 |
| Folkestone and Hythe | £4,861,266 | 1,760 |
| Gravesham | £3,045,912 | 1,140 |
| Maidstone | £4,502,558 | 1,629 |
| Sevenoaks | £2,655,197 | 1,031 |
| Swale | £4,433,345 | 1,824 |
| Thanet | £6,589,706 | 2,648 |
| Tonbridge and Malling | £2,568,230 | 1,016 |
| Tunbridge Wells | £2,622,328 | 991 |
| Bracknell Forest | £2,637,740 | 888 |
| Brighton and Hove | £9,818,727 | 3,449 |
| Buckinghamshire | £10,533,854 | 3,836 |
| Isle of Wight | £5,318,517 | 2,354 |
| Medway | £7,283,434 | 2,870 |
| Milton Keynes | £7,240,041 | 2,492 |
| Portsmouth | £6,603,393 | 2,547 |
| Reading | £6,493,762 | 1,686 |
| Slough | £6,187,653 | 1,624 |
| Southampton | £7,887,125 | 2,838 |
| West Berkshire | £2,800,483 | 1,167 |
| Windsor and Maidenhead | £3,200,759 | 1,093 |
| Wokingham | £2,280,886 | 845 |
| Cherwell | £2,805,401 | 1,121 |
| Oxford | £3,649,179 | 1,138 |
| South Oxfordshire | £2,349,262 | 959 |
| Vale of White Horse | £2,126,046 | 845 |
| West Oxfordshire | £2,035,924 | 800 |
| Elmbridge | £3,101,751 | 1,007 |
| Epsom and Ewell | £1,727,921 | 506 |
| Guildford | £2,353,849 | 872 |
| Mole Valley | £1,690,723 | 629 |
| Reigate and Banstead | £2,861,801 | 981 |
| Runnymede | £1,775,651 | 657 |
| Spelthorne | £2,437,063 | 829 |
| Surrey Heath | £1,789,860 | 586 |
| Tandridge | £1,687,152 | 624 |
| Waverley | £2,406,804 | 903 |
| Woking | £2,195,565 | 712 |
| Adur | £1,965,413 | 826 |
| Arun | £5,417,968 | 2,282 |
| Chichester | £3,099,656 | 1,312 |
| Crawley | £3,409,947 | 1,025 |
| Horsham | £2,669,074 | 1,091 |
| Mid Sussex | £2,665,878 | 1,047 |
| Worthing | £3,202,381 | 1,360 |
| Cornwall | £19,562,875 | 9,075 |
| East Devon | £3,876,068 | 1,790 |
| Exeter | £3,023,478 | 1,314 |
| Mid Devon | £2,159,230 | 949 |
| North Devon | £3,058,733 | 1,374 |
| South Hams | £2,586,897 | 1,115 |
| Teignbridge | £4,151,166 | 1,884 |
| Torridge | £2,357,166 | 1,065 |
| West Devon | £1,675,541 | 736 |
| Cheltenham | £2,618,313 | 1,062 |
| Cotswold | £1,918,773 | 859 |
| Forest of Dean | £2,660,812 | 1,092 |
| Gloucester | £3,539,716 | 1,343 |
| Stroud | £2,477,921 | 1,082 |
| Tewkesbury | £1,955,420 | 815 |
| Bournemouth, Christchurch and Poole | £13,521,849 | 5,387 |
| Bristol, City of | £13,218,721 | 4,666 |
| Dorset | £10,463,297 | 4,596 |
| Isles of Scilly | £40,804 | 13 |
| Mendip | ||
| North Somerset | £5,762,761 | 2,485 |
| Plymouth | £8,274,233 | 3,490 |
| Sedgemoor | ||
| Somerset West and Taunton | ||
| South Somerset | ||
| Swindon | £7,153,244 | 2,292 |
| Torbay | £6,780,564 | 2,848 |
| Wiltshire | £10,484,921 | 4,429 |
| Bath and North East Somerset | £3,996,325 | 1,703 |
| South Gloucestershire | £5,207,115 | 2,188 |
| Herefordshire, County of | £5,385,810 | 2,341 |
| Shropshire | £9,197,193 | 4,091 |
| Stoke-on-Trent | £8,448,794 | 3,747 |
| Telford and Wrekin | £5,838,729 | 2,448 |
| Cannock Chase | £2,771,648 | 1,327 |
| East Staffordshire | £2,593,651 | 1,161 |
| Lichfield | £2,155,864 | 1,045 |
| Newcastle-under-Lyme | £3,218,095 | 1,474 |
| South Staffordshire | £2,863,705 | 1,351 |
| Stafford | £2,664,120 | 1,231 |
| Staffordshire Moorlands | £2,169,805 | 1,032 |
| Tamworth | £2,086,410 | 981 |
| North Warwickshire | £1,644,052 | 777 |
| Nuneaton and Bedworth | £4,017,012 | 1,624 |
| Rugby | £2,373,882 | 947 |
| Stratford-on-Avon | £2,930,031 | 1,320 |
| Warwick | £2,771,513 | 1,191 |
| Birmingham | £51,900,146 | 17,094 |
| Coventry | £11,866,174 | 4,233 |
| Dudley | £10,292,032 | 4,590 |
| Sandwell | £16,789,358 | 5,847 |
| Solihull | £5,549,521 | 2,315 |
| Walsall | £11,250,450 | 4,524 |
| Wolverhampton | £12,440,699 | 4,378 |
| Bromsgrove | £1,858,598 | 884 |
| Malvern Hills | £2,151,751 | 951 |
| Redditch | £2,279,311 | 1,015 |
| Worcester | £2,516,339 | 1,081 |
| Wychavon | £3,174,974 | 1,365 |
| Wyre Forest | £3,070,861 | 1,431 |
| Craven | ||
| East Riding of Yorkshire | £9,895,707 | 4,685 |
| Hambleton | ||
| Harrogate | ||
| Kingston upon Hull, City of | £10,517,569 | 4,543 |
| North East Lincolnshire | £6,072,108 | 2,683 |
| North Lincolnshire | £5,090,349 | 2,301 |
| Richmondshire | ||
| Ryedale | ||
| Scarborough | ||
| Selby | ||
| Sheffield | £19,272,954 | 7,647 |
| Barnsley | £8,086,120 | 3,492 |
| Doncaster | £10,386,134 | 4,409 |
| Rotherham | £8,551,293 | 3,828 |
| Bradford | £19,952,425 | 7,405 |
| Calderdale | £5,916,412 | 2,623 |
| Kirklees | £12,477,614 | 5,169 |
| Leeds | £22,257,729 | 8,892 |
| Wakefield | £10,016,906 | 4,477 |
| York | £3,702,423 | 1,639 |
| Argyll and Bute | £3,187,298 | 1,338 |
| City of Edinburgh | £11,760,115 | 4,480 |
| Glasgow City | £34,358,697 | 12,649 |
| Na h-Eileanan Siar | £1,273,259 | 582 |
| Orkney Islands | £594,360 | 258 |
| Shetland Islands | £455,131 | 200 |
| Aberdeen City | £4,432,055 | 1,911 |
| Aberdeenshire | £4,327,223 | 2,121 |
| Angus | £3,111,442 | 1,426 |
| Clackmannanshire | £1,396,803 | 625 |
| Dumfries and Galloway | £6,403,086 | 2,635 |
| Dundee City | £5,533,746 | 2,323 |
| East Ayrshire | £4,701,615 | 2,054 |
| East Dunbartonshire | £2,346,787 | 951 |
| East Lothian | £2,456,617 | 1,121 |
| East Renfrewshire | £2,228,818 | 882 |
| Falkirk | £4,442,757 | 2,031 |
| Fife | £9,603,859 | 4,387 |
| Highland | £6,906,496 | 3,048 |
| Inverclyde | £3,510,497 | 1,513 |
| Midlothian | £2,252,784 | 1,002 |
| Moray | £2,240,181 | 1,082 |
| North Ayrshire | £6,308,541 | 2,636 |
| North Lanarkshire | £13,779,925 | 5,850 |
| Perth and Kinross | £3,943,921 | 1,722 |
| Renfrewshire | £5,852,983 | 2,559 |
| Scottish Borders | £3,053,054 | 1,494 |
| South Ayrshire | £3,990,687 | 1,748 |
| South Lanarkshire | £11,732,753 | 5,001 |
| Stirling | £2,256,651 | 969 |
| West Dunbartonshire | £3,773,509 | 1,664 |
| West Lothian | £5,047,916 | 2,211 |
| Isle of Anglesey | £2,805,867 | 1,219 |
| Merthyr Tydfil | £2,432,721 | 1,047 |
| Monmouthshire | £2,639,554 | 1,086 |
| Neath Port Talbot | £6,101,123 | 2,532 |
| Newport | £5,805,969 | 2,241 |
| Pembrokeshire | £4,811,352 | 2,067 |
| Swansea | £10,147,802 | 3,898 |
| Torfaen | £3,517,230 | 1,508 |
| Vale of Glamorgan | £4,143,637 | 1,630 |
| Wrexham | £4,553,196 | 1,946 |
| Conwy | £5,097,681 | 2,164 |
| Denbighshire | £4,330,237 | 1,817 |
| Flintshire | £4,648,589 | 2,053 |
| Gwynedd | £4,560,486 | 1,993 |
| Powys | £4,661,867 | 1,977 |
| Rhondda Cynon Taf | £8,815,801 | 3,931 |
| Blaenau Gwent | £2,972,461 | 1,336 |
| Bridgend | £5,139,488 | 2,105 |
| Caerphilly | £7,192,466 | 3,055 |
| Cardiff | £12,349,722 | 4,382 |
| Carmarthenshire | £7,693,605 | 3,100 |
| Ceredigion | £2,674,322 | 1,101 |
| £117,095,177 | 793,768 | |
| £2,248,080,563 | ||
| £0 | 0 |
Wider unclaimed support by local authority area
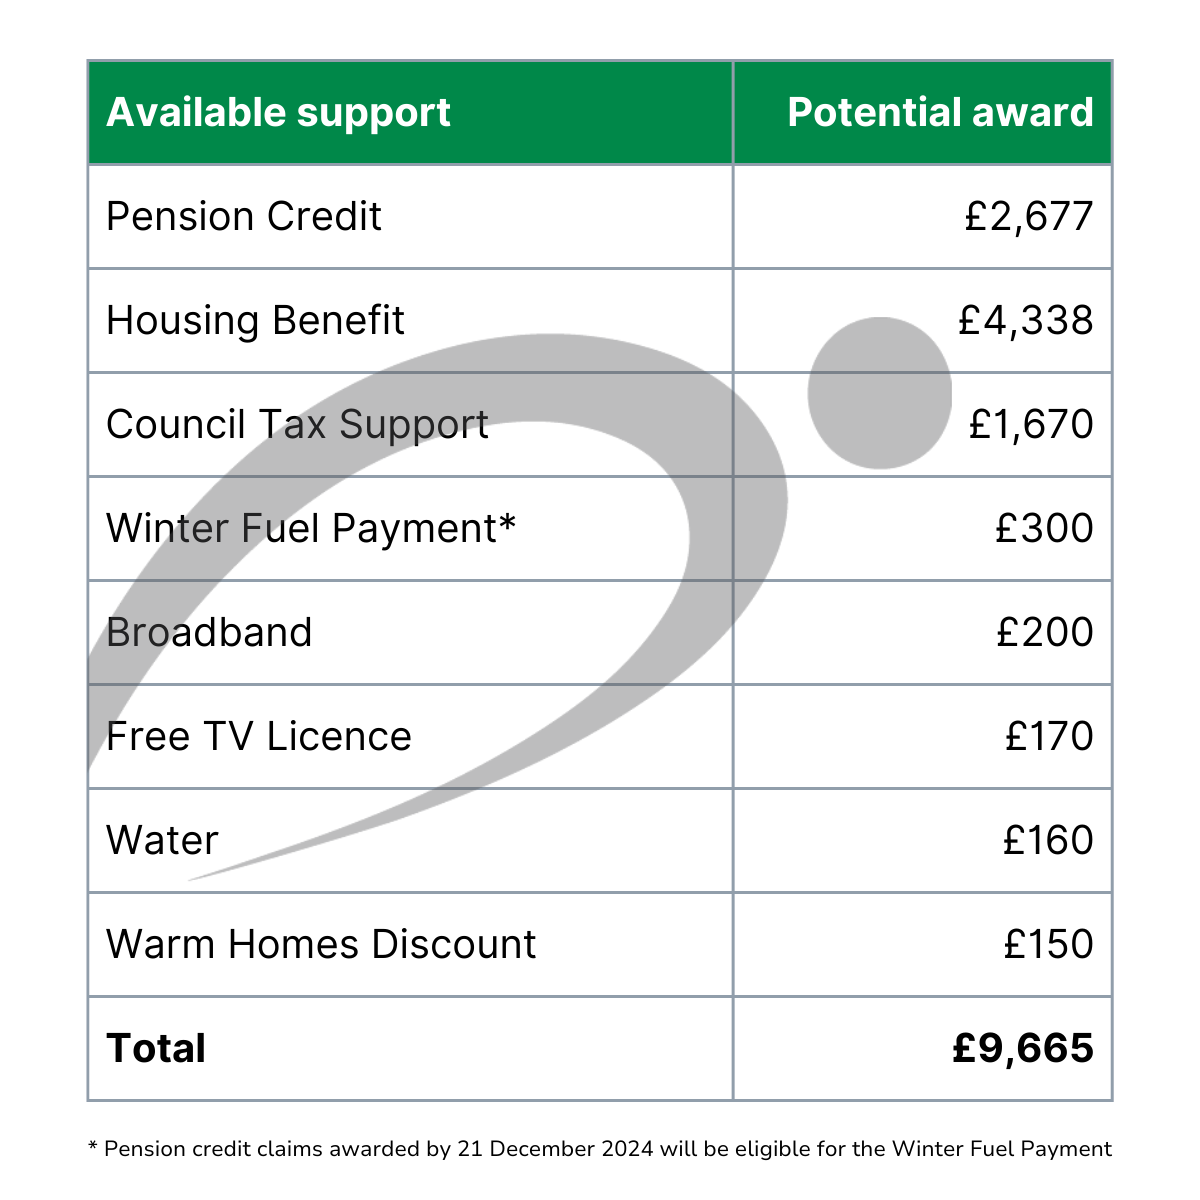
£24 billion of support goes unclaimed each year. Pension Credit is only one benefit included in this figure.
Book a free consultation to receive the breakdown of other unclaimed support in your area, including:
- Universal Credit
- Carer’s Allowance
- Housing Benefit (pensioner)
- Child Benefit
- Free School Meals
- Healthy Start
- Water social tariffs
- Broadband
- Warm Homes Discount
- Free TV Licences
Book a free consultation
By submitting this form I confirm that I have read the privacy policy and agree to the processing of my personal data by Policy in Practice for the stated purposes. I can revoke my consent to this processing at any time