An inflation linked rise to benefits is the minimum needed to protect low income families

Jack Rowlands Published on 13th October 2022

 A rise to benefits of at least 10% is needed to keep families afloat finds new analysis by Policy in Practice.
The Mini Budget gave much needed help to families, especially with energy bills. Those with average energy needs will see their ultimate payments return closer to the April cap of £1,277 but many low income households will have higher than average energy needs and will struggle.
At a time when household costs are going up, benefits have not kept pace.
Our analysis finds that benefits are worth 7.5% less in real terms now than they were in 2009, largely due to the multi-year benefits freeze.
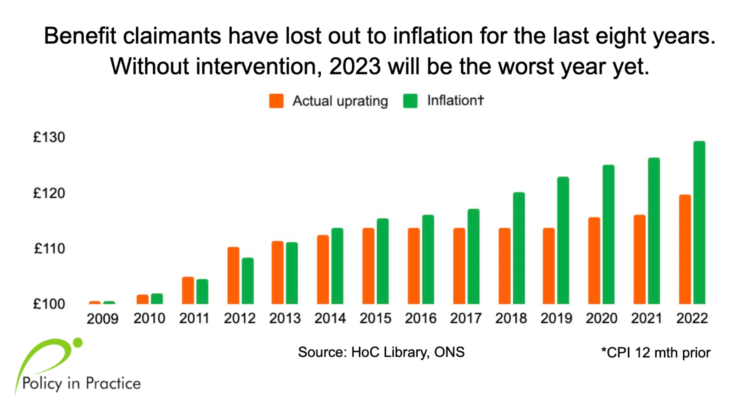
The graph above shows the changes to the standard rate of benefits (in orange) and the inflation rate in the same period (in green). By starting with a baseline of £100 in 2009, we can see that claimants have far less spending power than in 2009.
The benefits freeze for five years from 2013 has left benefits today 7.5% lower in real terms.
The price of essentials such as food, clothing and housing costs are rising fastest, at around 10%, yet benefit payments were only increased last April by 3.1%.
The government at the time justified the freeze on the basis that benefits had, from 2012-2013, risen above inflation.
A hidden benefits freeze: the benefit cap hits households harder
The other benefits freeze, which is less visible, but as impactful, is the decision to freeze the benefits cap. This has been set at £20,000 for couples and lone parents (£23,000 in London) since 2016.
If the benefit cap remains frozen, it will be £4,652 lower in real terms in 2023, a 23% cut. The cut is £3,000 greater if we use the original £23,000 (£26,000 in London) when the cap was first introduced in 2013. This makes the real term cut for benefit capped households as high as 38% in less than ten years.
A rise to benefits in line with wages in 2023 equates to a cut of 11.3% since 2009
When deciding how to uprate benefits next year, the government should look at the impact of inflation on the long-term value to claimants.
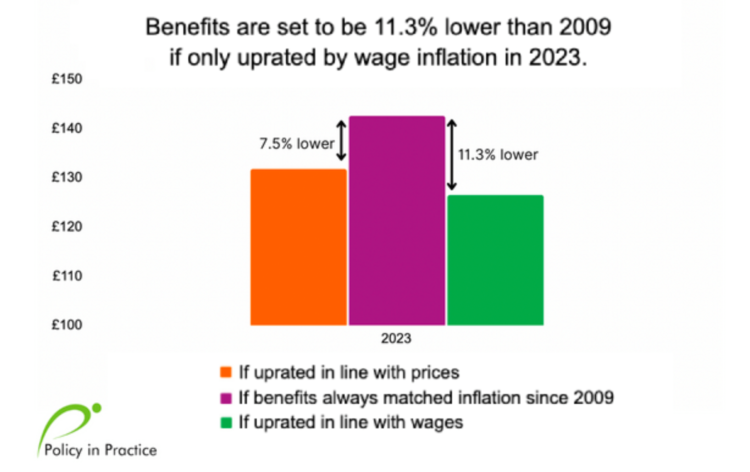
In the graph above, the green bar shows an increase to benefits of only 5%, in line with wage growth, in 2023. This falls far short of inflation (10%) and leaves the real value of benefits 11.3% lower in real terms compared with 2009.
The orange bar shows the value of a rise to benefits in 2023 if uprated by CPI inflation of around 10%. This would help claimants cope with rising prices by adding around £26.50 a month (£318 a year) to even the lowest rate of Universal Credit, but would still leave benefits 7.5% lower than in 2009.
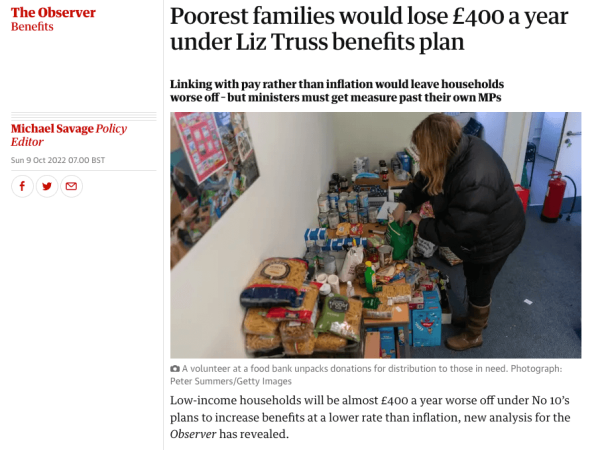
Households will be £395 worse off this year under rise to benefits by wage inflation proposals
We analysed data on 114,000 low-income households across England and Wales to measure the potential impact of the government’s decision to uprate benefits by wage growth of 5.5% rather than by CPI of 10%.
Our analysis for the Observer estimated how much a rise to benefits in line with wages would cost a typical household. The impact is particularly unfair on in-work households who will be £38.16 worse off a month, and those with children who will be £53.33 worse off a month.
These findings pose a challenge to the government’s stated policy of rewarding those who work and encouraging couples to start families.
We found that:
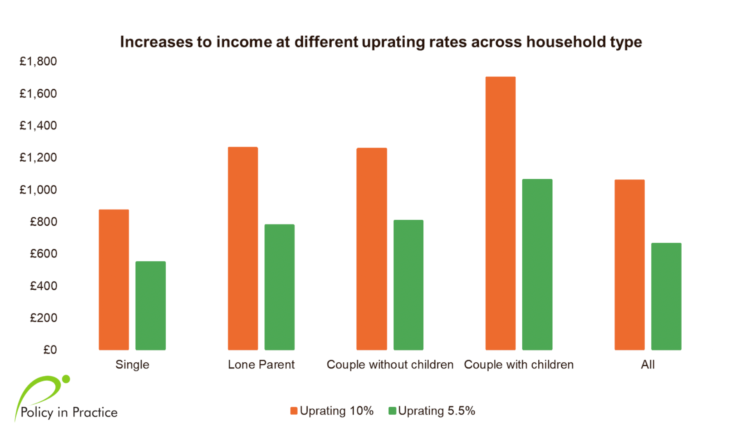
- On average, households will be £32.91 per month worse off if benefits are uprated by wages (5.5%) as opposed to CPI (10%). This represents an annual drop of £395 or a decrease of 2%
- Disposable income will fall for all household types in both scenarios. Uprating by just 5.5% will result in a 7.7% loss in disposable income on average. This is because prices in general, including energy and housing, are rising more
- Families with children will lose out more than smaller households because they rely more on income from social security.
- Couples with children are £640 worse off
- Single people are £325 worse off
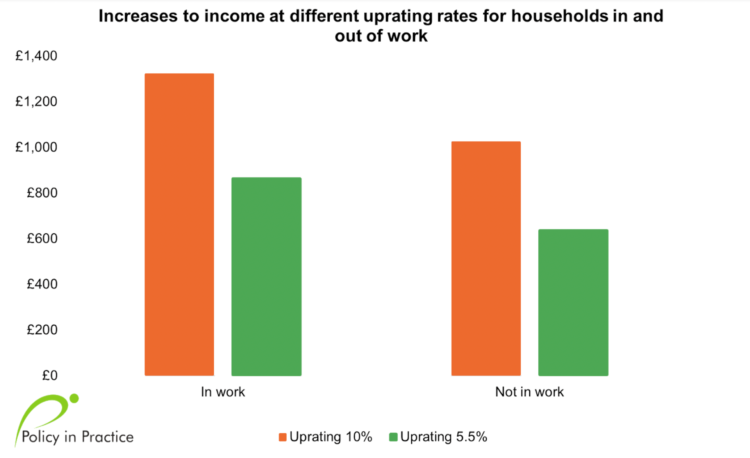
- Households in-work lose out by £458 if benefits are uprated by 5.5% instead of 10%
- Households out-of-work lose out by £385 if benefits are uprated by 5.5% instead of 10%
Taking costs into account:
- Households will be £75 worse off in real terms even with benefits uprated by 10%
- If benefits were uprated by just 5.5% they will be £470 worse off in real terms; disposable income will be six times lower in real terms.
Working households on Universal Credit need incentives not punishments
The government has said it will keep the triple lock, rightly arguing that pensioners need to be protected because they can’t easily increase their earnings. Disability Living Allowance (DLA) and Personal Independence Payments (PIP) are likely to be protected by standard procedures which uprate those benefits in line with CPI.
Yet some people who are unable to work will still be affected by real terms cuts to their non-disability benefits such as Universal Credit and Employment Support Allowance (ESA). There will be many people who are able to work some hours but face barriers such as caring responsibilities, childcare costs, or non-disability health issues (on limited capability to work).
All these groups of people face similar barriers to raising their incomes as pensioners, but their benefits enjoy none of the protections afforded to pensions which get increased by CPI.
Our analysis shows the impact is unfair on those in work, which represents 41% of people on Universal Credit. Failing to increase benefits in line with inflation will push low-income households further into poverty and debt. This won’t contribute to economic growth but it will increase poverty. It risks creating social issues that will cost the public sector more in the longer term.
Next steps
- Hear RT Hon Chloe Smith MP deliver the keynote speech at Policy Exchange’s webinar A gold mine for growth and opportunity: Unleashing the full potential of the labour market, Thursday 13 October at 14:00. Details and registration
- Join Policy in Practice’s free webinar, Forecasting the fight against fuel poverty, on Tuesday 18 October at 10:30. With Pat Knight, Gravesham District Council. Details and registration
- Listen back to our webinar, How to identify and support Just About Managing households using data, with Jane Worrell, Folkestone and Hythe District Council. Access webinar on demand