Cost of living: How the energy price cap affects different households

Izabel Bahia Published on 05th September 2022

Policy in Practice has recently explored how energy bills are calculated and what the energy price cap is.
In the second of two blog posts on the energy price cap Izabel Bahia explores the impact of the energy price cap in different households, taking into account household size and energy efficiency. Her analysis finds that energy bills could jump to over £11,000 for larger families, nine times greater than for smaller households.
Definition of an average UK household, and why this is important
The energy price cap is reported based on the average UK household. The average UK household has 2.4 people and consumes 2,900kWh of electricity and 12,000kWh of gas each year.
Table 1 shows the average energy bill based on the relevant price cap. The bill is for gas and electricity, paid by direct debit and the property is somewhat energy efficient, assuming an EPC rating band of D.
| Energy price cap | Amount |
|---|---|
| October 2021 | £1,254 |
| April 2022 | £1,971 |
| October 2022 | £3,549 |
| January 2023 (forecast) | £4,266 |
In reality, the actual amount that people pay can vary significantly, based on:
- the size of the home
- how energy efficient the property is
- whether the bill is paid by direct debit or prepaid
- the household’s actual usage of gas and electricity
For example, we know that 78% of households in the lowest income decile are single people living alone. Low-income households are more likely to have a prepayment meter which is usually a more expensive way to pay for energy, and they may live in an energy inefficient property.
The assumption that the average household has access to both gas and electricity overlooks the 2.5 million households (9%) that are heated by electricity only, and 1.5 million (5%) that depend upon oil for heating.
The cost of oil has increased on the same scale as other forms of energy, and those who use oil are not protected by the energy price cap.
Households that don’t fall into the average parameter don’t know what to expect this winter.
In order to better target emergency support we need to understand more about how the increase in the energy price cap affects different household types.
Let’s look at the impact of the rising energy price cap increase on different household sizes, forms of payment and across various EPC ratings.
Large households are more likely to pay higher energy bills
Table 2 shows that the largest households will be paying almost £5,000 this autumn, rising to over £6,100. This means that the cost of living measures announced by the government in May, based on the energy price cap, are already insufficient to meet the needs of larger families
| Apr 2022 | Oct 2022 | Jan 2023 (forecast) |
|
|---|---|---|---|
| Flat or one bedroom house (1-2 people) | £1,364 | £1,952 | £2,962 |
| Three bedroom house (2-3 people) | £1,977 | £3,549 | £5,386 |
| Five bedroom house (4-5 people) | £2,735 | £4,898 | £7,433 |
Less energy efficient homes likely to see higher energy bills
As expected, households living in less energy efficient properties will face higher energy bills this winter.
The current fuel costs of a small flat or one bedroom house, EPC band D, for 1 or two people is £1,364 a year, as shown in Table 2. The same household could save more than £505 a year by living in a highly energy efficient property.
The average spend for single households in small flats or houses living in EPC band G properties is £2,604 a year, a difference of £1,745 between the most and least energy efficient. Energy costs for single households living in an EPC band G property are expected to be over £6,500 in January 2023.
| Energy efficiency | Annual energy bill (Oct 22) | Annual savings / costs | % difference |
|---|---|---|---|
| High (EPC A/B/C) | £2,804 | £745 | -20% |
| Average (EPC D) | £3,549 | N/A | N/A |
| Low (EPC G) | £8,500 | -£4,951 | 58% |
The current fuel costs for a highly energy efficient five bedroom property, for a family of four or five people is £2,156. The same household size can pay £6,534 in a band G property, and this bill will rise to £17,801 this winter.
Although large households tend to be better-off families, the unprecedented scale of this energy crisis will also squeeze the income of middle class families, a demographic that has not yet needed government support.
| EPC rating | Annual energy bill (April 22) | Annual energy bill (Oct 22) | Annual energy bill (Jan 2023 forecast) |
|---|---|---|---|
| EPC A/B/C | £1,562 | £2,804 | £4,255 |
| EPC D | £1,977 | £3,549 | £5,386 |
| EPC G | £4,735 | £8,500 | £12,899 |
When we combine the impact of household size and energy efficiency we see that despite the price cap, families living in medium or large properties that are the least energy inefficient may be paying nearly £12,000 per year from October, as shown in the bar chart graph below.
Customers living in energy inefficient properties might be paying 139% above the average.
In the graph below we have calculated the estimated energy costs per household size and EPC rating by combining different datasets. 2022 Annual Fuel Poverty Statistics, British Gas data on energy consumption per household and Cornwall Insights January 2023 forecast provided data on energy consumption and EPC ratings. From these sources we calculated the ratio between energy costs in April and October and applied it to household energy costs in different EPC bands to forecast the differences in April 2022, October 2022 and January 2023.
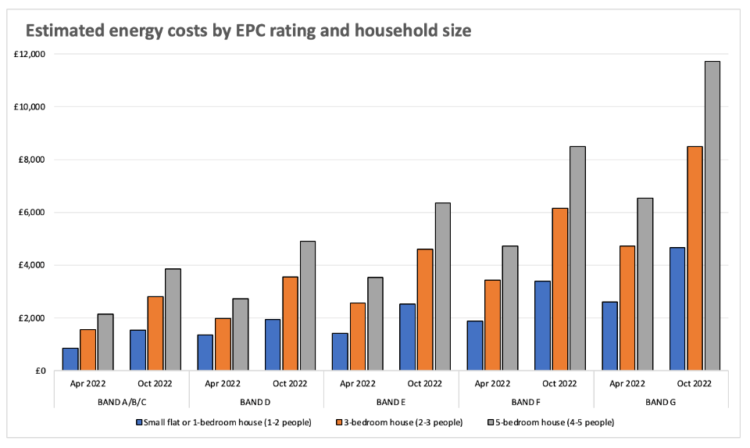
Source: Policy in Practice analysis, based on Cornwall Insight’s forecast, British Gas data on energy consumption per household type and Annual Fuel Poverty Statistics in England, 2022.
Household budgets are already being hit
We can already see evidence that households feel the strain on their budgets. Data from Citizens Advice shows that the value of energy debts has almost doubled since 2019. Similarly, the number of people contacting frontline staff for information on grants and benefits to help with their energy bills increased from 8,255 in June 2021 to 109,000 in May 2022.
Councils we speak to are increasingly concerned about the growing requests for discretionary support, a large number of which are coming from those working full time but ineligible for welfare assistance. Particular issues that residents are looking for help with include rising private housing costs amid rising landlord repossessions, reliance on charities and food banks and demand for temporary accommodation.
Prepayment meter customers pay 2% more for their energy
Customers may pay their energy bills through a prepayment meter or have a direct debit set up, typically a more expensive to prepay for energy. Based on the current April 2022 energy price cap, customers paying via direct debit pay on average £1,971 a year. Prepayment customers are facing bills of £2,017 which equates to a poverty premium of 2%.
The use of prepayment meters has a relatively high correlation to living in fuel poverty. There are approximately 4.5 million prepayment meters across Britain, more than half of those customers have an income less than £18,000 a year.
Research from Citizens Advice shows that customers who prepay for their energy are typically vulnerable and more likely to ration or limit their energy use. In May 2022 Citizens Advice frontline staff witnessed 3,600 cases of people unable to top up their meters, more than the whole of 2021. Ofgem analysis shows that 14% of prepayment customers self-disconnected at least once a year.
Being cold is associated with poorer health outcomes. It increases the risk of stress, anxiety and social isolation. The NHS has warned the government of the humanitarian costs of high energy prices. Clinically vulnerable households could be forced to stay in hospital, or even die, because it is unaffordable for them to heat their homes or cook warm meals.
Case studies
When we combine the impacts of property size, energy efficiency and payment method, we find that large households may pay nine times more than single households in January 2023.
Case study: Single household, EPC band B that pays by direct debit
A single person living in an energy efficient home paying by Direct Debit will currently pay an estimated £859 a year. This is 43% less than the average UK household bill of £1,977.
By October 2022, the single person will be paying £1,542, rising to £2,340 in January 2023, an increase of 172% in nine months.
Case study: Large family in a four bedroom property, EPC band G that pays by a prepayment meter
A large household of six living in an energy inefficient house on a prepayment meter is currently paying £6,665 a year. This is nearly eight times that of the single household described above and 237% of the average energy bill.
This family’s bill might increase to £11,964 in October and £18,157 further this winter, an increase of £11,492 per year between April 2022 and January 2023.
Different types of households need more help with the energy price cap
Although welcomed by many households, the measures announced by the government last May do not take into account household needs or how energy efficient a property is.
Emergency policies to be announced by the next Prime Minister will need to better target support to larger households in the short term and improve energy efficiency across the UK in the medium to long term. This will cut our bills, and is the cheapest way to our lower carbon emissions while reducing our dependence on fossil fuels.
Further analysis and response to the cost of living crisis
We will be publishing our full analysis on the new energy price cap figures over the next few days. Subscribe to our blog to automatically receive the following posts by email.
New analysis: Increasing Universal Credit by 13.3% will help low-income households pay for increased energy costs
Our new analysis shows that increasing Universal Credit will neutralise rising energy bills and household costs for low income households.
New analysis: Three costed policies to help low-income households with the cost of living crisis
Our three costed policies to help households through the cost of living crisis require investment of £6.8billion to prevent severe hardship.
New analysis: A full breakdown of the results from our analysis on 114,000 low-income households
- Families with children will be £1,700 worse off on average by April without further support
- The number of households that will not be able to meet their expected monthly costs will double from January
- Almost 1 in 5 single households will not be able to afford all of their essential costs without additional support.
Subscribe to our blog to automatically receive the final post in this series by email.
Help for households struggling to afford energy bills
Over £15 billion of existing benefits and support is unclaimed by households every year. We strongly encourage people to use a free benefits calculator such as the Better Off Calculator to ensure they’re claiming all the support they’re eligible for. Households can also contact their energy supplier and local Citizens Advice for help.