5 Things we learned from the Benefit Cap impact assessment

Janet Harkin Published on 10th August 2015

A lower Benefit Cap will be introduced across the UK from April 2016.
The DWP recently released a new lower benefit cap impact assessment explaining the reasons behind the tightening of benefit cap, and its expected outcomes.
5 Previously Unanswered Questions About the Lower Benefit Cap
The Impact Assessment of the Lower Benefit Cap has helped to clarify some previously unanswered questions:
- At what level is the new lower benefit cap set?
- How will the new lower benefit cap be implemented?
- What have the outcomes of the benefit cap been so far?
- How many people will be affected by the lower benefit cap?
- Who will be hardest hit by the lower benefit cap?
5 Answers About the Lower Benefit Cap
1. While the original benefit cap was linked to median earnings, the lower benefit cap is loosely set at the 40th percentile of earnings
The impact assessment provides some further information regarding the way in which this lower benefit cap was designed, and how it will be implemented.
The Department for Work and Pensions has opted for a tiered approach, with a higher benefit cap of £23,000 in the 32 London boroughs and the City of London, and just £20,000 per year in the rest of Great Britain.
This tiered approach is intended to control for the higher rental costs in the capital, which until now accounted for almost half of all capped households nationally.
Both in London and elsewhere, the lower benefit cap is now approximately equivalent to the 40th percentile of earnings – meaning that capped households will have incomes lower than 6 out of 10 households.
2. Implementation will be gradual, starting in April 2016
The impact assessment now clarifies some questions that were previously unanswered.
The document suggests that there will be a phased rollout of the lower benefit cap from April 2016, with a view to complete it around the end of the year.
This would replicate the implementation of the initial benefit cap in 2013, which began in four London boroughs before being implemented across Great Britain.
3. While the benefit cap does lead to employment outcomes for some households, others see a fall in living standards
One of the government’s main motivations in lowering the benefit cap is to further increase work incentives for benefit claimants.
The DWP document states that “the new lower, tiered cap strengthens work incentives, achieves fairness for taxpayers and ensures there is a reasonable safety net of support for the most vulnerable.”
Reference is made to a previous publication by the DWP, which found that 19% of capped households moved into employment after a year, compared to just 11% of a similar uncapped group.
In fact, households that were capped by greater amounts were even more likely to find work – the impact assessment suggests that households that are already capped will see their work incentives increase even further as a result.
However, there remain some questions about the work incentives of the benefit cap.
Statistics show that, over the last two years, only four of every 10 households that were initially capped and then avoided the cap did so by claiming Working Tax Credit.
The rest of these managed to avoid the cap in other ways such as applying for a benefit that exempts them, or stopping their Housing Benefit claim.
A DWP study in 2014 found that more households were likely to spend less on household essentials (35%) than to look for a job (28%) as a result of the benefit cap.
This suggests that, although the benefit cap did successfully strengthen work incentives for many households, a sizeable number of families see a reduction in living standards rather than a move into work as a result.
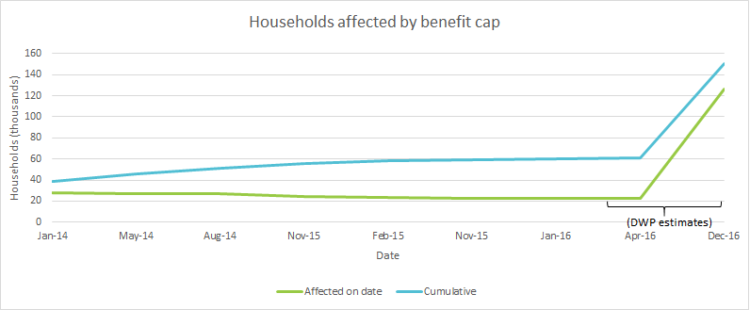
4. Five times more households will be impacted by the lower benefit cap
As of May 2015, there were 22,500 UK households affected by the benefit cap.
Since the introduction of the cap, 62,600 had been affected by it at some point.
The DWP’s latest impact assessment estimates that the number of households affected may jump up to 126,000 under the new benefit cap rules, taking the number of households that will be affected at some point to 150,000. (Note that this is a static estimate – and therefore probably and over-estimation).
Another interesting question is that of the demographic make-up of households affected by the new benefit cap.
These numbers have remained more or less stable so far, with about 60% of affected households being lone parents, and the remainder being couples with children and families with no children.
The latest impact assessment estimates that 64% of claimants capped under the new regulations will be single women, and a further 12% will be single men – this suggests that the proportion of couples with children affected by the lower benefit cap will go down from its current level of 31%.
This is because households with high rents and no children will increasingly fall within the new benefit cap amounts, and we should expect to see more child-less households being capped.
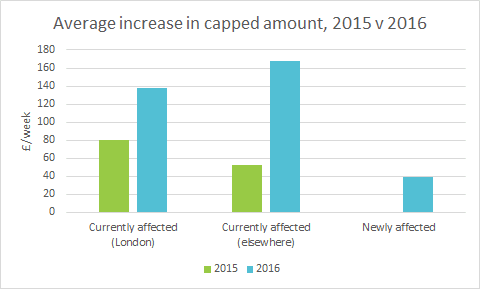
5. Households outside of London that are currently capped will be the hardest hit
At the moment, households affected by the benefit cap see their benefit entitlement reduced by an average of £80/week in London, and £52/week elsewhere.
Due to the tiered implementation of the lower benefit cap, this is likely to change from 2016 onwards.
Couples and lone parents outside of London who are already capped will see an annual income reduction of £6,000, compared to just £3,000 for those in London.
Thus, if Londoners are currently the most affected by the benefit cap, it is likely to be non-Londoners who will be hardest hit from April 2016.
The chart below shows this difference:
We have seen how the latest DWP impact assessment predicts fundamental changes to the lives of thousands of benefit claimants.
New household types will need increasing support, as will households out of London that are already capped.
It is now up to local and national institutions to ensure that this transition is as smooth as possible.
How Policy in Practice Can Help
The new benefit cap rates will be updated on the Universal Benefit Calculator as soon as they are implemented nationally.
Please watch our recent webinar to see how our consultancy work can help your residents to prepare for the upcoming changes.
To request a call or meeting to discuss your specific welfare reform policy delivery issues please click here.


