How data and design can tackle homelessness: Luton case study

Janet Harkin Published on 15th August 2018
Across many social areas, from policing to identifying young people at risk of becoming NEET, predictive data modelling is increasingly being used to identify people at risk and track their progress against the support they receive. This approach offers huge opportunity to create targeted awareness channels, measure impact and make the case for further investment. An accompanying service design wraparound maximises the return on the investment.
This blog highlights how Policy in Practice and innovative service design company Uscreates are using predictive data within service design work and makes the case for a service design approach to data-led projects. Together we’re helping Luton Council develop a data-led early intervention homelessness prevention service.

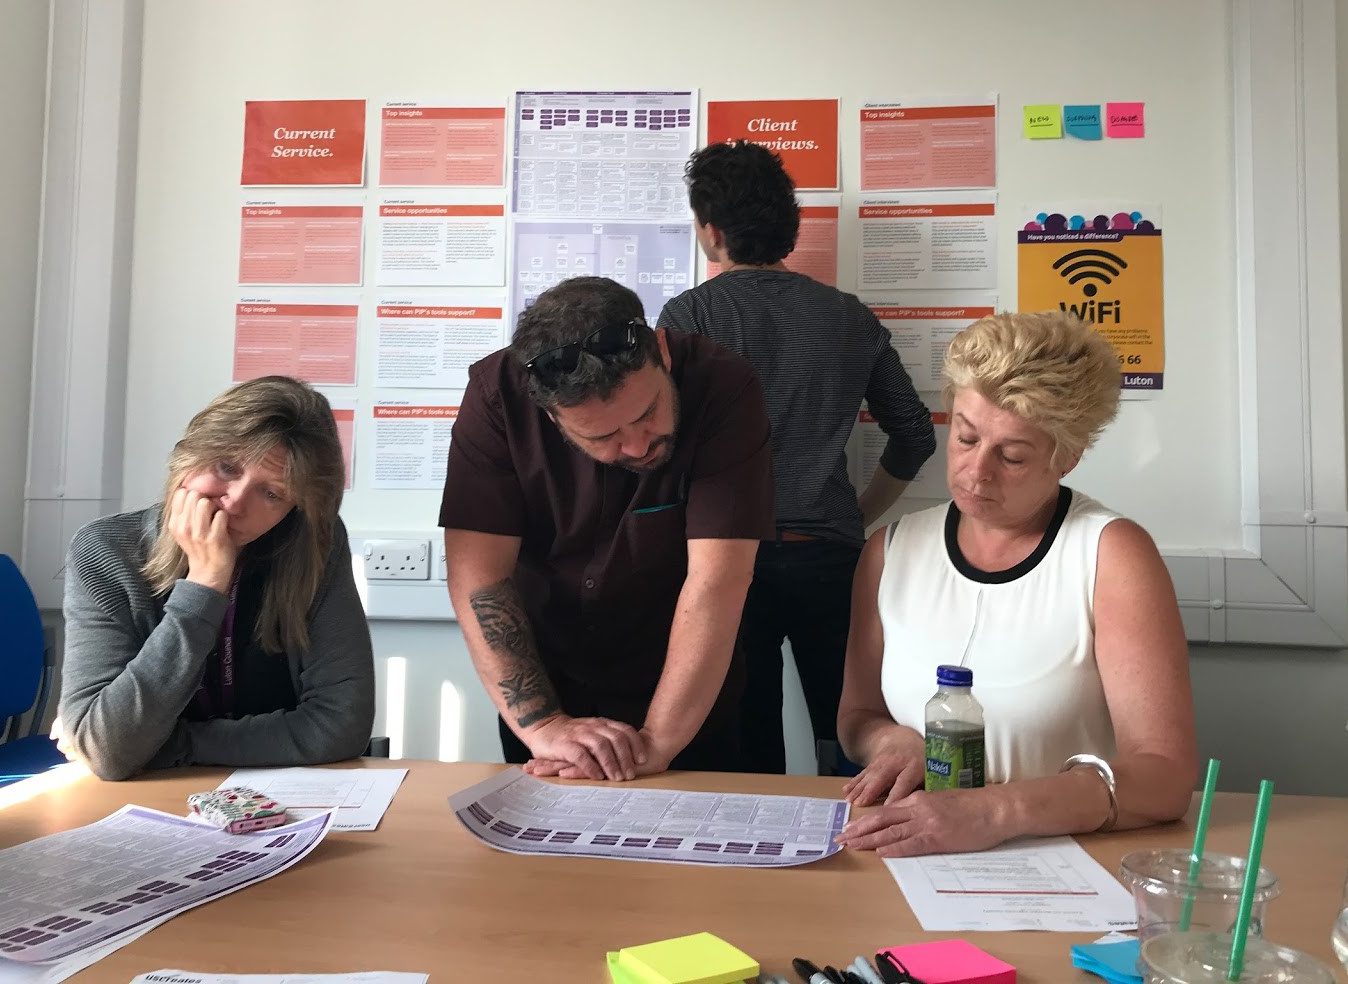
Policy in Practice and Uscreates worked with Luton’s frontline staff to tackle homelessness using data and service design
Data and design can tackle homelessness
Luton Council already has a homelessness prevention service which supports clients up to 56 days (previously 28 days) before eviction, as required by the new Homelessness Reduction Act. Using data to predict who might be at risk before those 56 days will help people to take more action themselves, either through self-service online tools or community-led support, meaning the council can prioritise its resources for those who are most in crisis. This is really exciting.
The original Policy Lab and MHCLG project that informed the Trailblazer set out predictive data modelling as one of the referral routes into redesigned services. Some councils have been exploring this and found it challenging, so it is great to have the chance to work with one, Luton, that was ambitious in taking this pioneering approach.
Policy in Practice had already been commissioned to provide a predictive data tool to proactively identify people at risk of homelessness and we could see the value that Uscreates can provide by designing the subsequent support service and building the capability of frontline staff to use the data to continuously iterate the service.
Uscreates took a user-centred, design-led approach. They conducted staff observations, ethnographically informed interviews with customers, mapped community assets, co-designed an earlier outreach service and prototyped elements such as the contact text or letter, online self-help wireframes. At the same time, Policy in Practice created the data dashboard, and over the summer Luton staff are testing the prototypes with a first cohort of customers.
Four interesting learnings so far
Some of the biggest insights, challenges and immediate takeaways from this project so far are:
1. Thinking through the ethics of using data to identify individuals at risk: making sure the data used has the correct consent, making clear to those identified why they were being contacted, building in verification of their situation and providing choice over the service they receive. The initial touchpoint between the council and identified household was crucial. Even though it might have been more appropriate for a community-led service to contact those at early risk, legally it had to be the council as they were the data owners. We prototyped different channels and language to explain the contact and to collect other data, for example personal resilience / support networks, which determine the type of support they received.
“As long as they’re going to help me I don’t care if they own my data! If they are willing to help, I would be willing to tell them anything they need.” Customer interview
2. Early intervention and the role of the council. Providing an early intervention service went beyond the council’s statutory duty, which is to support those at risk of homelessness 56 days before an eviction, but not before. We had to provide an earlier intervention service which also manages expectations and supports residents too.
“Anything, any issues that is over a month, I will try and solve it myself. For anything that needs to be done in under a month, I’d go to the council.” Customer interview
3. Getting the buy-in of frontline staff in delivering a data-driven services. Frontline staff could have felt concerned about the potential of data automating their service, or ill-equipped to understand what the data was telling them about how their service was working. Rather than simply introducing the data dashboard to staff and training them in how to use it, we involved the staff throughout. We did this by interviewing them during the discovery period to understand how they currently used data, what their data needs were and what they thought, through their tacit knowledge, was the most important data to use in the model. We introduced predictive data examples from other sectors and co-designed the data-led service with them.
4. Even though we had a data-led solution in mind, not introducing it too early meant we could stay open to insights created in the discovery period. We wanted to be able apply the data opportunities to the areas that Luton needed most, framing it correctly so that staff could see it as adding value to their work, rather than being ‘yet another computer system’. We also needed to understand user needs so develop a support service that would help prevent early homelessness.
The future: data analysis and service design go hand in hand
Over the coming years, predictive data analysis and machine learning will become increasingly dominant. We need to make sure we can humanise this technology, using it in ways that are ethical, sensitive and understood. Data is the lifeblood of services and can help identify those who might benefit from them, track how people are using them so they can iteratively improve, and measure impact to make the case for them to scale. Service designers need to be data designers.
Further reading
- Uscreates have built a model for a service design ‘wraparound’ data projects.
- Policy in Practice’s large scale study on low income Londoners shows how analysing data sets at scale can reveal insights that can shape the design of social policy.
- Subscribe to Uscreates’ newsletter here (footer)
- Subscribe to Policy in Practice’s newsletter here