Data analysis shows 1 in 4 London households will be in poverty by April

Mary-Alice Doyle Published on 14th March 2022
The UK’s official relative poverty estimates are outdated, limiting how useful they are in helping us to understand poverty rates and the current and likely impacts of the cost of living crisis. Administrative data can help fill this gap. Policy in Practice is trialing methods to estimate real-time poverty rates using local authorities’ administrative data.
Official data on poverty rates is too slow
The most recent data available on UK poverty rates is from the financial year ending in April 2020, just before the pandemic began. We know there have been very significant changes in the nation’s financial health since then.
The number of Universal Credit claims has increased from 3 million to 5.5 million, inflation has gone from near-zero to over 6%, and wages and benefit payments have not kept up. This means that households’ real purchasing power, the amount that they can afford to buy with their budgets, has declined.
Some commentators suggest that these dynamics are hitting low-income households the hardest and will mean an increase in poverty in the UK. But by how much?
Official data telling us how these dynamics are affecting poverty rates will be available in about a year from now. But practitioners and policymakers cannot wait a year to find out how these changes are likely to affect household living standards.
Poverty rates better estimated using administrative data
Policy in Practice has estimated poverty rates in London using data shared as part of a broader project to create a living standard index for low-income Londoners. This project is funded by Trust for London, with data contributed by 15 London Boroughs.
Using this data we can estimate accurate poverty rates for households receiving Council Tax Support (CTS), a local means-tested benefit for the lowest-income households. We combine this information with the most recent Family Resources Survey and data from DWP StatXplore to help us estimate how many benefit claimants receive CTS.
Analysis of admin data shows 120,000 families in London fell into poverty since the beginning of the pandemic
Analysis of admin data shows London poverty increased by 3.5 percentage points since the beginning of the pandemic. This increase is equivalent to an additional 120,000 households falling into poverty since the beginning of the pandemic.
We estimate that 19% of households in London were in relative poverty before housing costs and deductions at the beginning of the pandemic. This has increased to 22.5% today.
This change has happened in two stages.
In the first year of the pandemic many households lost their primary income source, as reflected in a stark increase in the number of households claiming Universal Credit. At the peak of the pandemic around a quarter of London households were claiming Universal Credit. This meant many more households had incomes around or below the poverty line.
The full effects of this fall in employment income on poverty rates were masked at the aggregate level because, at the same time, the introduction of the £20 Universal Credit uplift meant that many households already claiming benefits were lifted above the poverty line.
The £20 Universal Credit uplift did a good job of preventing a large-scale increase in poverty rates by halving the number of households falling into poverty, from 1.4% with the uplift to 2.7% without the uplift. Whilst the share of London households in poverty still increased, it could have increased by a lot more.
The second stage of the recent increase in poverty came with the removal of the £20 Universal Credit uplift.
The number of households claiming benefits has declined from its peak but remains high, meaning a very large number of households saw a fall in their incomes in late 2021 with the removal of the £20 uplift. This change pushed some households below the poverty line.
We estimate that the removal of the £20 Universal Credit uplift increased poverty rates in London by 1.3 percentage points.
| Total proportion in poverty | Change | |
|---|---|---|
| Q1 2020 | 18.9% | |
| Q1 2021 | 20.3% | 1.4% |
| Q1 2022 | 22.3% | 2.0% |
| Q2 2022 | 24.2% expected | 1.9% |
Source: Estimates based on CTS data, DWP StatXplore and 2019 ONS estimates of households by borough
Based on the assumptions below our analysis of local authority administrative data for 2021 suggests that poverty rates will show an increase of 1.4% over the prior year, rising to over 1 in 5 households in London. Administrative data allows us to analyse the change over a year before the release of official statistics. Offical data for 2021 is due to be announced on 31 March 2022.
- Table shows the percentage of households in relative poverty before housing costs
- Assumes relative poverty rate among UC households is 10 percentage points lower than CTS households, and absolute poverty rates are the same between the two groups
- Poverty rates for other households assumed constant as in 2019-20 FRS
- The removal of the £20 UC uplift is modelled as contributing to an increase in poverty rates that is of the same magnitude as the decrease that happened in April 2020 when it was first introduced
- Projection assumes 7% inflation, 3% benefit uprating, 4% wage growth, and a 1.25% reduction in employment income with the National Insurance increase
Cost of living crisis will push 66,500 more Londoners into poverty
As has been well documented, the cost of living has risen substantially in recent months and is expected to increase further. In addition, the 1.25 percentage point increase in National Insurance that will be introduced in April will also reduce take-home pay for most working households.
These changes will be only partly offset by wage growth and benefit uprating. The latest data suggests wage growth is currently around 4%, while benefits are set to be uprated by 3% in April.
As a result, households’ real incomes, that is, income after accounting for the increase in the cost of living, will fall. The fall for low-income households receiving benefits will be greater because they will experience the larger average gap between income growth and cost of living growth.
Our estimates suggest that this will push a further 1.9 percent of London households, or 66,500 households, into relative poverty.
How we created these estimates
These estimates are an approximation. They help us to get an idea of what’s going on, but they can’t tell us everything that the official data would.
The main reason for this is that we create these estimates based on data on people who receive local means-tested benefits. But this means we miss data on two groups: people who are eligible for these benefits but do not claim them, and people who are not eligible for these benefits, such as those with no recourse to public funds, but may still have low incomes. Our model assumes that the share of the population that falls into these groups is constant over time.
We will need either the official estimates, which are based on a representative survey of the UK population, or administrative data linked across government agencies, and therefore covering people not present in the benefits data, to test these assumptions. If the number of people in these groups has increased over the past two years, then our estimates are a lower bound on the actual scale of the increase in poverty.
These estimates reflect poverty at the household level compared to the official poverty statistics which show poverty at the individual level. It is likely that more than 24% of individuals in London will be in poverty because poverty is more common in larger households.
More information about the methodology behind these estimates is available here.
How analysing administrative data can help policymakers
This increase in poverty rates is alarming, however it’s much better to understand the likely scale of the problem now, instead of in a year’s time when official statistics are released and more families have hit crisis.
Repeating this analysis can lead to a better understanding of the strengths of administrative data and its relationships to official survey-based statistics. The resulting insights mean that policymakers and frontline practitioners have the information needed to act early to provide preventative support.
It means policymakers at a national and a local level will be able to act quickly. Decisions around the £20 uplift, or a more comprehensive approach to tackle cost of living pressures as discussed in our recent blog post, would have been better informed.
How local authorities can prepare for rising poverty rates
Frontline workers and local authorities can help to alleviate the worst of the crisis by targeting support to those who need it most. These statistics will be available to councils using our Low Income Family Tracker platform (LIFT).
Targeting support where it is most needed to prevent crisis is a challenge that some leading councils are meeting head on by analysing their own administrative data. With support from LIFT they are able to unlock information from their datasets that allows them to identify vulnerability, target support and track change.
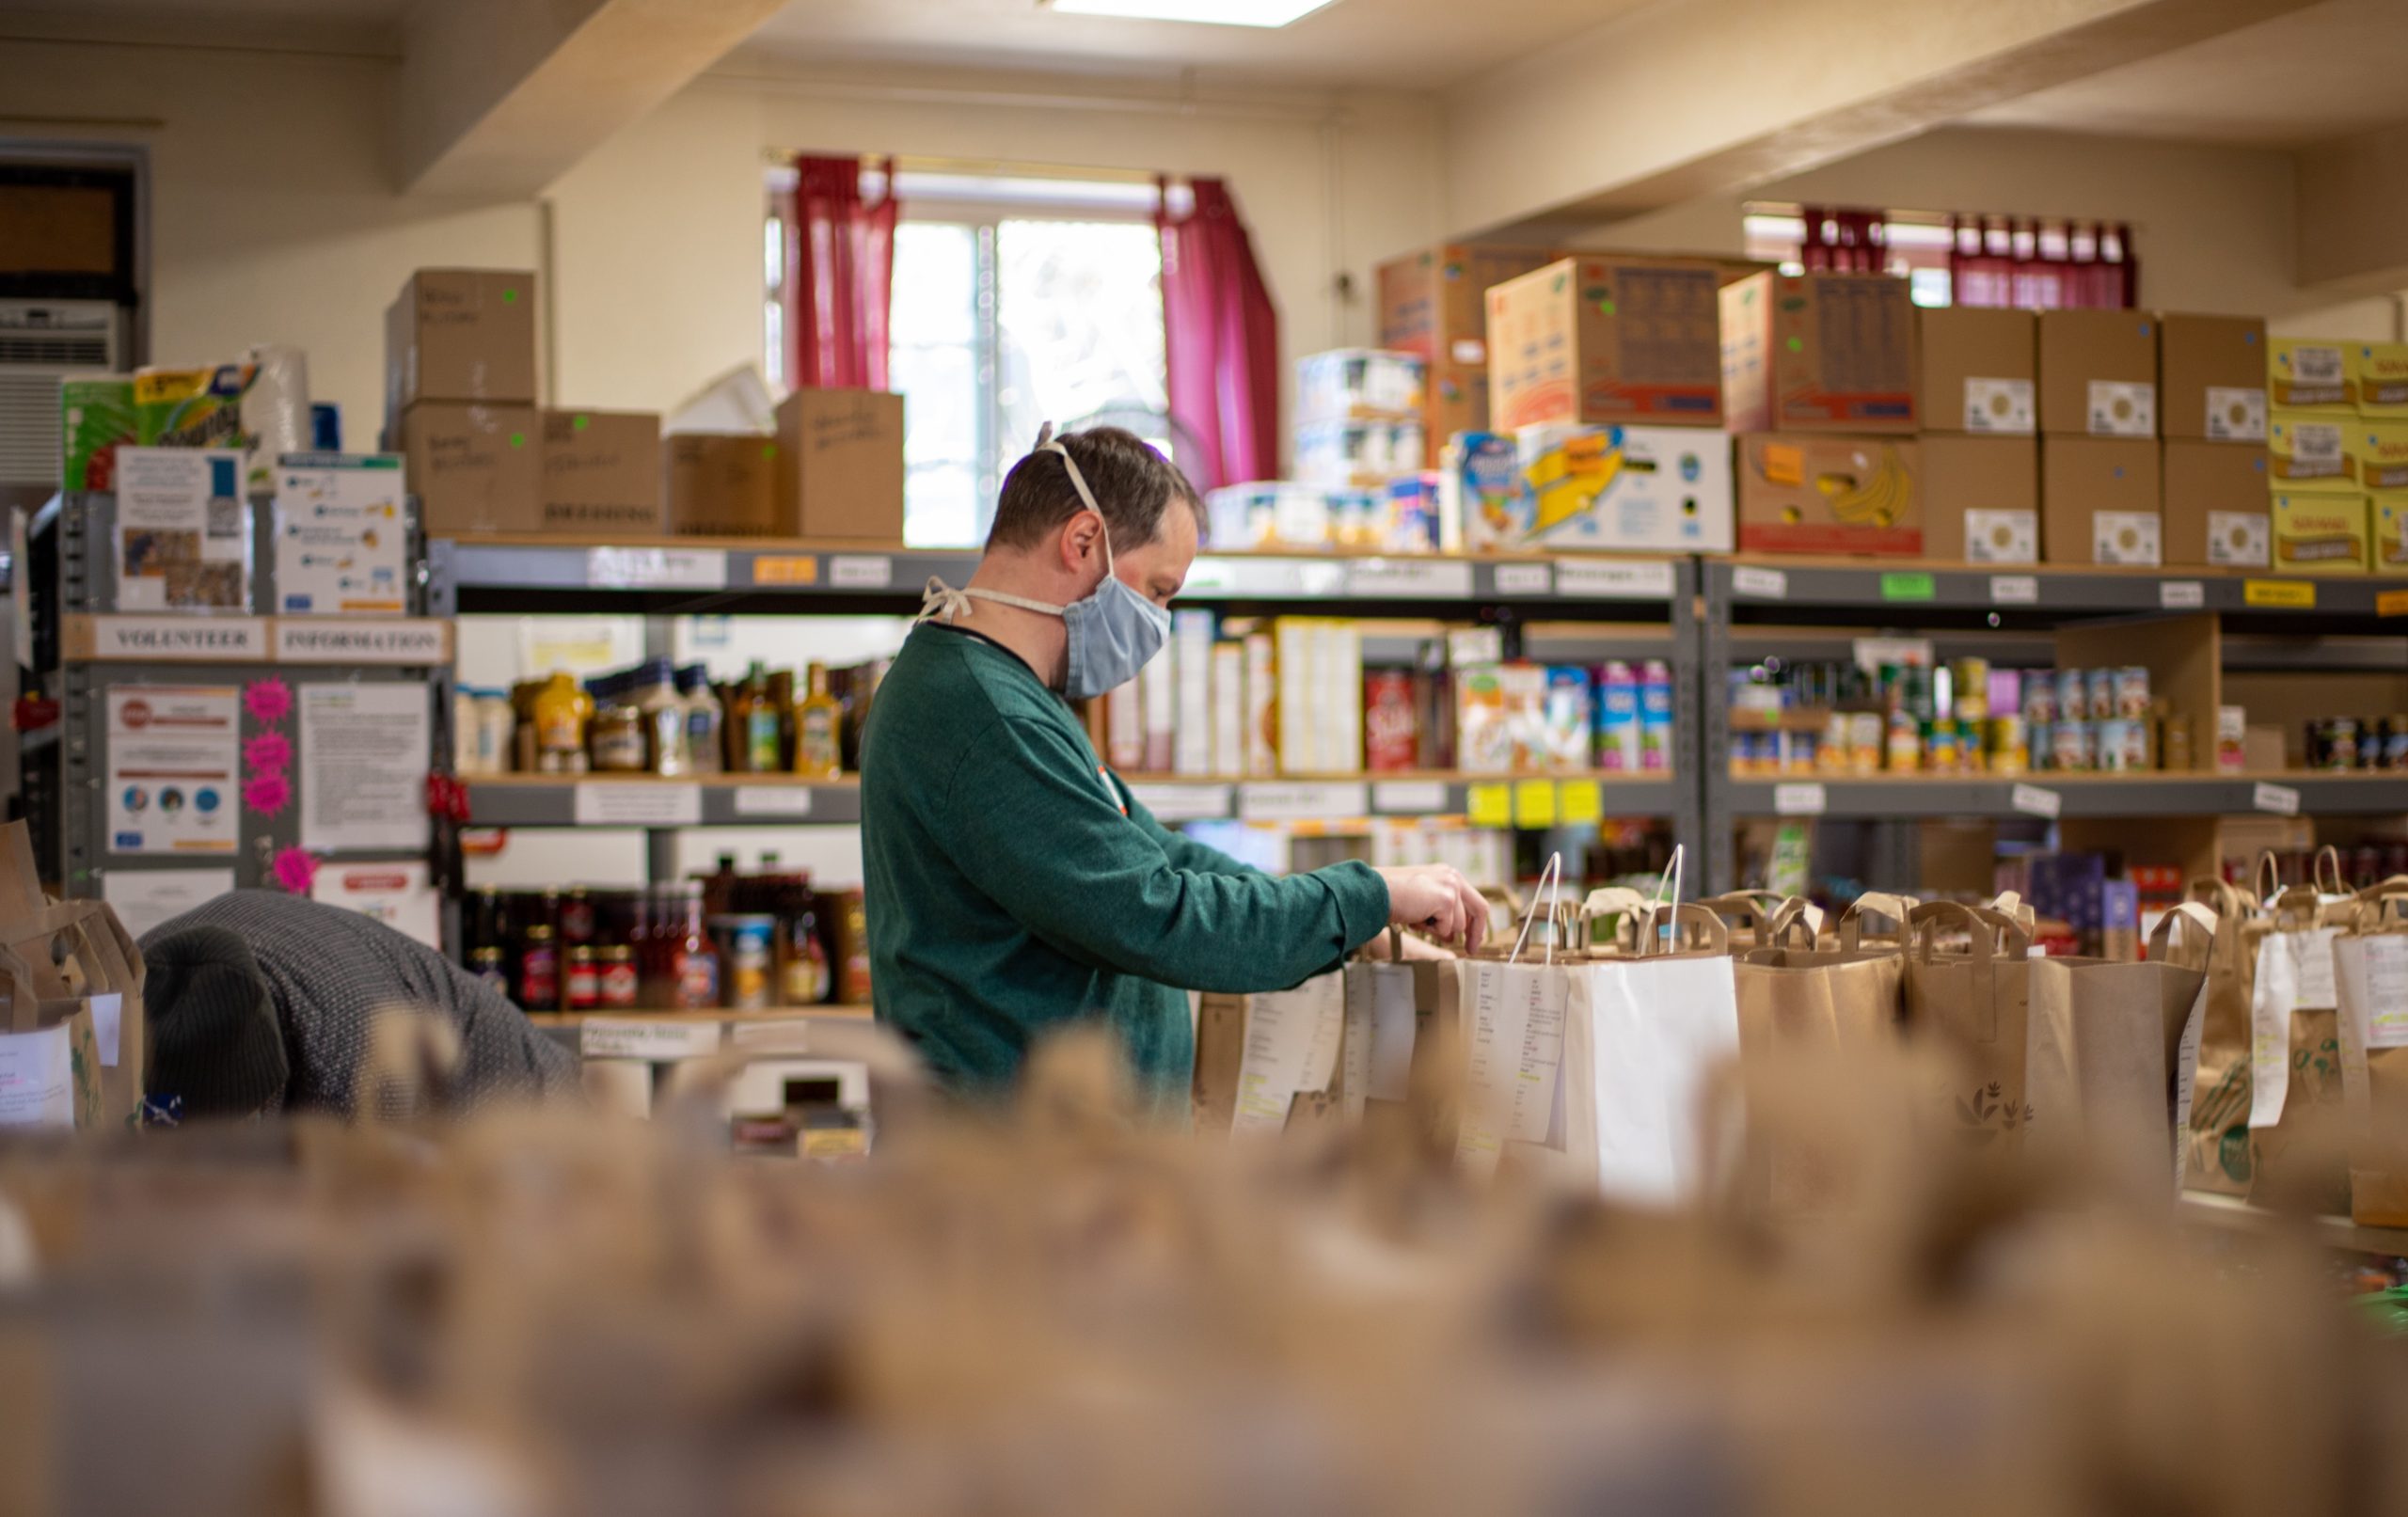
Haringey Council, like many councils, are using their administrative data to creatively ensure that residents are getting support. On a recent Policy in Practice webinar looking at the use of data to tackle the cost of living crisis, Margaret Gallagher, Head of Performance and Business Intelligence at Haringey Council, said “There’s nothing more satisfying than knowing that we’ve identified an issue and can tell the story of what we’ve done to help. Recently, the LIFT platform identified that we have 5,187 households estimated to be in food poverty.”
Listen back to our on-demand webinar with Haringey Council here.