Universal Credit: the impact across London Boroughs, Big Cities and Small Cities and Towns

Janet Harkin Published on 24th May 2016

In our National Picture of Welfare Reform series we reveal what we have learnt about the different impacts of welfare reforms. Our analysis is based on household-level data from local authorities that has been anonymised, aggregated and analysed for London Boroughs, Big Cities and Small Cities and Towns.
The first blog introduced our analysis on the National Picture of Welfare Reform and, in this second post, we focus on the varying impact of Universal Credit nationwide. To learn more about our household level impact assessment service, click here.
Universal Credit: the current context
As the rollout of Universal Credit gathers pace, Phase 1 of the rollout begins in a further five towns and cities (Bath and North East Somerset Council, Newcastle City Council, Rugby Borough Council, Sedgemoor District Council and Waveney District Council) this month. The target date for nationwide rollout of the full service is set for June 2018. All households in receipt of benefits should be on Universal Credit by 2021.
“I am absolutely committed to leading a continued, successful roll out of Universal Credit. That is a priority for me.”
The Rt. Hon Stephen Crabb MP, Secretary of State for Work and Pensions
With this development comes renewed scrutiny, not least over the impact of the cuts in work allowances which threaten to undermine the intent of Universal Credit – to make work pay. The Resolution Foundation’s report Universal Challenge – Making a Success of Universal Credit stresses the need for significant changes in how Universal Credit is targeted and deployed, identifying ‘recent cuts to the generosity of in-work support’ which it says need to be ‘restored – and then reshaped’.
As Universal Credit enters a new phase Policy in Practice considers the practical issues of targeting and deployment. Drawing on our experiences of working with local authorities already in transition, we look at how local authorities can best prepare for the forthcoming transition. In particular, we highlight the value of proactively adapting to the reforms before they arrive.
The transition to Universal Credit: a national picture
Once councils move to the full service, Universal Credit is set to accelerate.
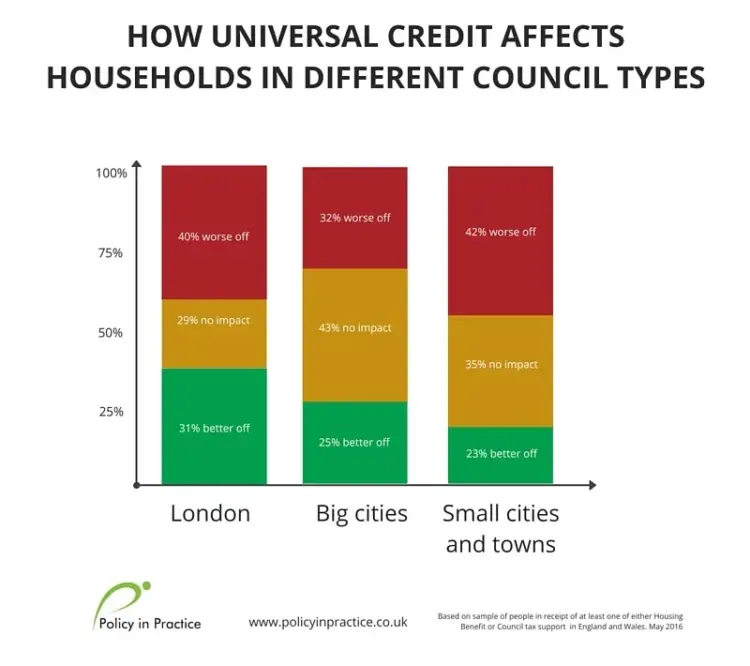
As the above graphic shows, the picture for low income households varies throughout the country. London will see 31% of its residents better offer, 40% will be worse off. Small Cities and Towns will be under particular pressure, with 42% of residents worse off, compared to 32% in Big Cities. These variations between types of councils can be attributed primarily to differences in the number of working age households and the proportion of people who are in or out of work.
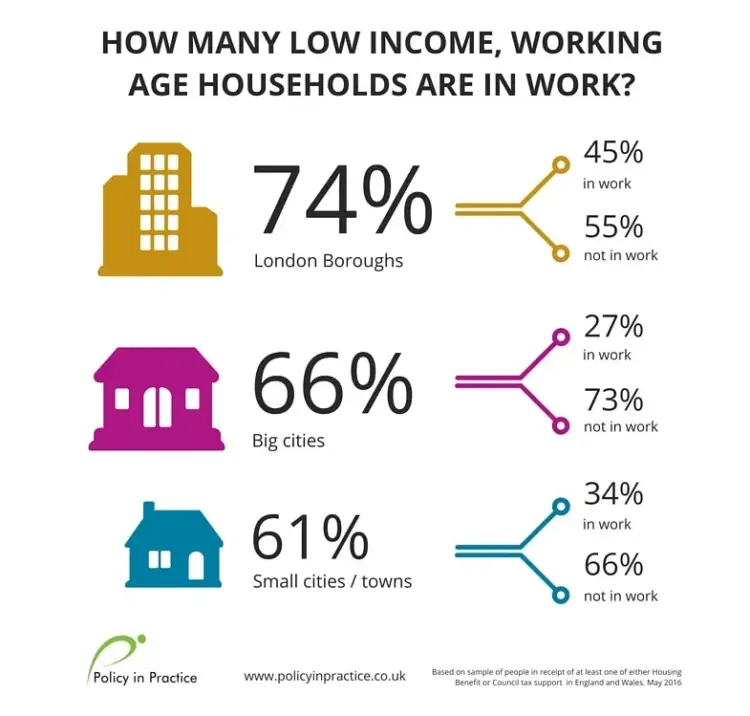
The two local authorities with the highest levels of working age households in work (both in London) will see the most households better off in 2016, whilst the two local authorities with the lowest in-work levels will see the fewest better off.
Having higher working-age populations to begin with, see below, London populations contain more people in a position to take advantage of other reforms, such as the new national living wage and tax allowance, which target those in employment.
Supporting households: from weekly to monthly payments
Residents will also see their pattern of support disrupted as the frequency of payments change from weekly, as now, to monthly.
“The monthly budgeting is the biggest difference… people are taking advances and they don’t actually understand… that you’re actually going to have to pay that back.”
Housing Association client in a Universal Credit Full Service Area
It can take up to five weeks for people to receive their first payment under Universal Credit. Emergency loans are available to cover the interim shortfall, yet these may cover only half of a Universal Credit payment, and will need to be paid back, thus potentially eating into a household budget for months after.
The change in approach to budgeting is as significant for many households as the financial impact. This underlines the need for rounded, personalised support which goes beyond data analysis to meet the needs of each specific area.
The danger of average numbers masking extremes
There is a limit to the story that these broad trends can tell. Each individual council has its own unique demography, and each household its own situation. Our approach to analysis assesses the impact of each individual welfare reform on each household to identify vulnerability, and help local organisations to prioritise support.
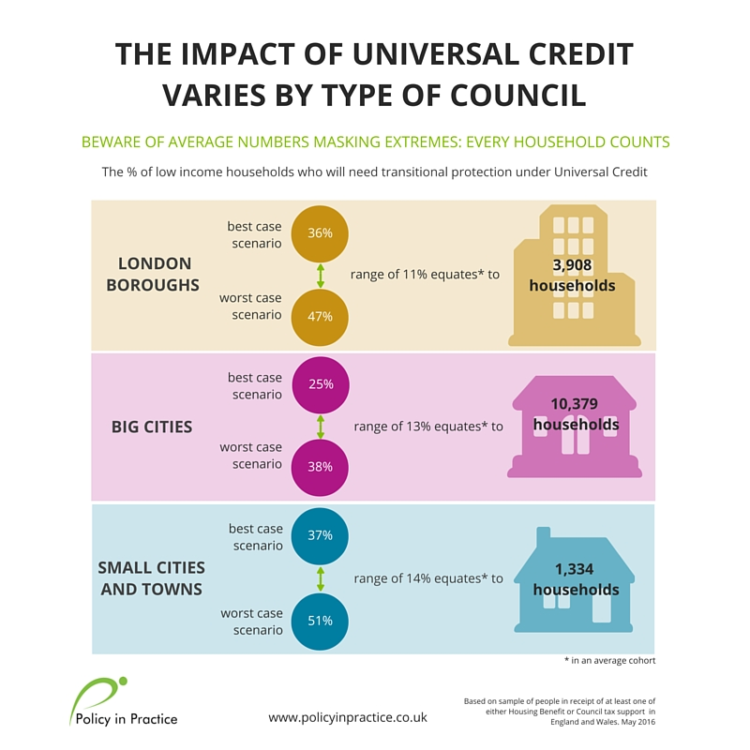
The diagram below shows the worst / best case scenarios for the number of households who will be worse off under UC in each of the three council types. It highlights the danger of average numbers masking the extreme figures. Every household counts.
Small Cities / Towns see the greatest degree of variation, with the percentage of households worse off under UC ranging from 37% to 51%. An 11% range represents 3,908 households in a typical London borough, a substantial number that may be in need of additional support as Universal Credit is introduced.
Case studies: using the insights proactively
By identifying exactly which households will be better or worse off, we can help local authorities to target different types of support at different groups.
Imagine knowing which households would be better off under Universal Credit, and those that would need transitional protection. Those that were better off would be much more likely to take up an employment support offer, or to progress in work.
The analysis is also able to model the cumulative impact of reforms. Comparing income in 2016 to 2020, we find that in our sample households will be £11.71 better off in 2020 than in 2016. Moreover, the gap between London councils and small cities and towns will fall from being £6.13 worse off under Universal Credit if it were rolled out today, to households being £1.82 worse off in 2020, as mitigating measures have an impact.
Yet this won’t be uniform for all households. By identifying those that are unlikely to benefit from mitigation today, councils may be able to better target pre-emptive and proactive support to improve budgeting, or to support these households into or on in work.
Summary
As the rollout of Universal Credit accelerates, it will be critical to understand the impact it will have on local authorities and on each individual household within them. Clear national benchmarks can play an important role to track the impact of reforms, and of local interventions. Understanding where the impact of Universal Credit is most extreme, and where a particular council fits against broader national trends, is a useful first step.
However, local authorities can go further to identify the individual households in their area who are most in need of support. By undertaking a household-level analysis they can fully understand the impact, decide exactly what solutions to develop and deliver proactive, personalised support to the most vulnerable households, at the right time.
If you want to find out more about how we could help your local authority do this contact hello@policyinpractice.co.uk.
Find out more
- Read the first blog in our National Picture of Welfare Reform series:
Welfare Reform: comparing the impacts on London, big cities and small towns
- Join our webinar The Postcode Lottery of Welfare Reform: Are you hit the hardest? on Thursday 26 May at 10:30 to hear our full analysis. You will learn:
1. How your local authority peers are impacted by welfare reforms (by council type)
2. What impact the lower benefit cap, Universal Credit and housing reforms will have (by council type)
3. How households in your local area are likely to be affected
We will also discuss what mitigating action you can take now to minimise the impact of welfare reforms on your customers.
In the next blogs in our National Picture of Welfare Reform series we look in more detail at the impact of the Benefit Cap and, finally, the Under-Occupation Charge (Bedroom Tax) and LHA Cap. We will also illustrate, through case studies, how local authorities can proactively prepare for the rollout of further welfare reforms.


