New analysis: Three costed policies to help low-income households with the cost of living crisis

Abigail Everett Published on 02nd September 2022

 More support must be given to low-income households to handle upcoming energy price increases. Part one of our four part series sharing our new cost of living analysis looked at how increasing Universal Credit can neutralise rising energy bills and household costs for low income households. In this second post we explore a set of costed policies to help low-income households with some of the pressures of the cost-of-living crisis.
In May, the government introduced a series of one-off payments to try to moderate the impact of the cost-of-living crisis, particularly for those who are most vulnerable in society, including those on benefits.
Since this announcement the situation has significantly worsened, with October’s energy price cap now set at £3,549 and January’s cap forecasted at over £5,380. Much more must be done to target support to households on the lowest incomes.
Policy in Practice has costed three policies to tackle the upcoming increases in the energy price cap which will bring significant financial challenges to millions of UK households.
- Proactively uprate means-tested benefits by 13.3% in October and again by 8.5% in January, at a total cost of £5.2 billion
- Extend Free School Meals to all Households on Universal Credit which would help 1.87 million children from 1.32 million households, at a cost of £682m
- Restore Universal Credit Work Allowances to their 2015 levels, at a cost of £841m
Policy in Practice’s new analysis for the Centre for Social Justice finds that households with children will on average pay £166 per month more for their energy bills in October than in July. This will increase to £212 in January.
Read: On Target: Protecting Vulnerable Households from the Inflation Crisis
Three costed policies to help low-income households with rising bills
Option 1: ‘Proactive uprating’ of means-tested benefits by 13.3% in October 2022 and by a further 8.5% in January 2023
Increasing Universal Credit and introducing a similar payment for legacy benefit and Pension Credit claimants would benefit 8.5 million households by £609 on average over the six months to April 2023.
Uprating Universal Credit by 13.3% in October and then again by 8.5% in January would help to neutralise the upcoming rises in energy costs for the households that are least able to take a hit to their incomes. It would also give more support to larger households with higher energy bills.
For example, single parents with two children would receive an extra £347 between October and January and an extra £598 between January and April. Couples with two children would receive £423 extra from October and £729 extra from January. Single people without children would receive £133 extra from October to January and £230 extra from January to April, as shown in Table 1.
The Centre for Social Justice argues that this is the ‘most targeted way to shield low-income households from the worst of inflation’ with 4.7 million households receiving an extra £609 on average over the autumn and winter months, as shown in Table 1.
This increase should be mirrored for those receiving legacy benefits and Pension Credit, administered either as one-off payments or, preferably, in a more targeted way by local authorities using administrative data. The 2.6 million households on legacy benefits and the 1.5 million Pension Credit households would each gain by £224 on average for the three months between October and January and by £385 between January and April, as shown in Table.
8.5 million people would benefit from this package which would cost £5.2 billion in total, as shown in Table 2.
Table 1: Full cost over six months of uprating Universal Credit by 13.3% in October 2022 and by a further 8.5% in January 2023
| Number of people receiving | Current monthly awards | 13.3% uprated monthly award | 8.5% uprated monthly award | October-January difference | January-April difference | 6 month increase | Cost to gov for October-January | |
| Single | 3,457,000 | £334.91 | £379.45 | £411.71 | £44.54 | £77 | £364.02 | £1,258m |
| Couple | 709,000 | £525.72 | £595.64 | £646.27 | £69.92 | £121 | £571.41 | £405m |
| LCW | 24,884 | £132.89 | £150.56 | £163.36 | £17.67 | £30 | £144.44 | £4m |
| LCWRA | 809,271 | £354.28 | £401.40 | £435.52 | £47.12 | £81 | £385.07 | £312m |
| One child | 812,700 | £290.00 | £328.57 | £356.50 | £38.57 | £66 | £315.21 | £256m |
| Two children | 1,077,300 | £534.58 | £605.68 | £657.16 | £71.10 | £123 | £581.04 | £626m |
| Total | £2,861m |
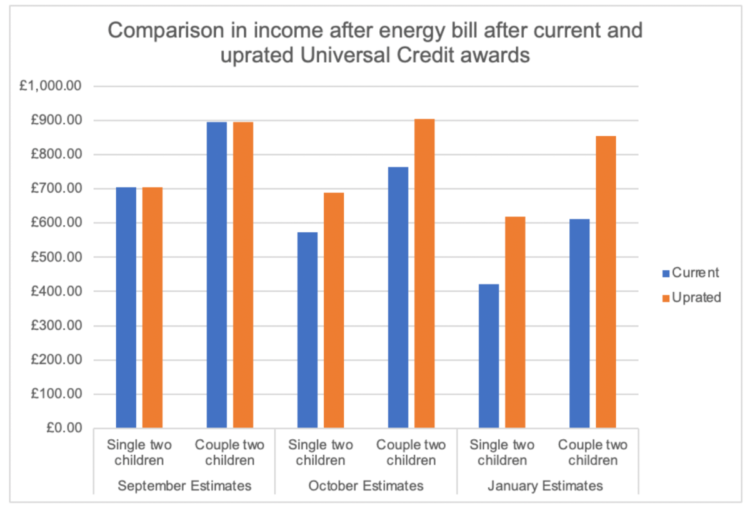
The graphic above shows the difference between Universal Credit awards and the price caps in September, October and January for single parents and couples with two children. It shows the difference between keeping Universal Credit at its current rate and uprating it by 13.3% in October 2022, and then by a further 8.5% in January 2023. Uprating Universal Credit means that some of the reduction in income caused by the energy price cap rises is mitigated, leaving households with more income after paying these bills.
Table 2: Cost of uprating Universal Credit and having a similar payment for legacy benefit and Pension Credit households
| Number of households | Amount received in October 2022 | Amount received in January 2023 | Total cost October – April | |
| All Universal Credit households | 4,700,000 | £224 | £385 | £2,862m |
| All legacy benefit households | 2,600,000 | £224 | £385 | £1,583m |
| All Pension Credit households | 1,244,548 | £224 | £385 | £758m |
| Total for means-tested benefits | 8,544,548 | £5,204m |
Uprating means-tested benefits by 13.3% in October 2022 and then by a further 8.5% in January 2023 would cost the government £5.2 billion in total and see households receive an extra £609 on average over 6 months.
Option 2: Extend Free School Meals to all households on Universal Credit
In July, Policy in Practice advocated for extending Free School Meals to all households on Universal Credit as a way for the new Prime Minister to tackle the cost of living crisis while improving work incentives. This would remove one of the few remaining poverty traps in Universal Credit.
Currently, families lose their entitlement to Free School Meals once their earnings rise above £7,400 a year, creating a poverty trap for those earning just above the threshold. These households would be significantly worse off than those earning just below the threshold.
Our recommendation would reach 1.87 million children in 1.32 million households and would cost the government roughly £682m.
The cost to the government can be reduced through a range of mechanisms.
- This estimate assumes full take-up of the support. It is likely the cost will be lower since take-up for Free School Meals is between 76% and 88%
- Instead of completely withdrawing the Free School Meals for families above the threshold, parents might contribute a portion of the costs
- Universal Credit work allowances might be drawn on for households that choose to partially fund school meals. In effect, these families make their contribution to school meals through the reduction in their work allowance
Option 3: Restore Work Allowances to 2015 levels
Policy in Practice analysed the costs and benefits of restoring work allowances earlier this year.
We have updated this analysis and found that restoring work allowances to 2015 levels would help Universal Credit households in work and mean that 1.3 million households gain an average of £663 per year (Table 4). This would cost £842 million (Table 3).
According to the CSJ this would represent an effective ‘tax cut’ for 1.67 million of the poorest working households’, and help more people to move into work.
Further support would be needed, however, to help households who are unable and not expected to work as they would still continue to face high living costs.
Table 3: Full costing for restoring Work Allowances to 2015 levels (excluding the taper rate)
| Family Type | Number of households in work | With housing element | Without housing element | Annual change in Work Allowance | Annual cost increase | |||
| With housing element | Without housing element | With housing element | Without housing element | Total | ||||
| Single, no children | 767,859 | 511,906 | 255,953 | £1,332 | £1,332 | £682m | £341m | £1,023m |
| Single, with children | 510,523 | 340,349 | 170,174 | £0 | £1,932 | – | £329m | £329m |
| Couple, no children | 61,053 | 40,702 | 20,351 | £1,332 | £1,332 | £54m | £27m | £8m |
| Couple, with children | 204,132 | 136,088 | 68,044 | £0 | £0 | – | – | £0 |
| Disability | 329,420 | 219,613 | 109,807 | £0 | £888 | – | £97m | £97m |
| Total on UC working | 1,872,986 | 1,248,658 | 624,329 | |||||
| Total benefiting | 1,328,506 | 772,221 | 556,285 | £736m | £794m | £1,530m | ||
Table 4: Breakdown of costs and benefits per household in work
| Number of households in work | 1,872,986 |
| Number of households in work benefiting | 1,328,506 |
| Total cost without taper rate | £1.5 billion |
| Taper rate | 55% |
| Total cost with taper rate | £842 million |
| Annual gain per household | £633.58 |
Our three costed policies give the government more options to support vulnerable households this winter
The incoming Prime Minister has the ability to use the existing social security net to provide targeted support to vulnerable households ahead of the winter. They could implement each of these policies independently or together.
Implementing all three of these policies would cost the government around £6.8 billion. The cost of living crisis and the increases to the energy price cap will impact all households, however low-income households are disproportionately impacted.
These costed policy measures created by Policy in Practice can give much needed support to households facing significant financial hardship. Investing in this support could help to prevent households from falling further into financial crisis this winter.
Further analysis and response to the cost of living crisis coming up
We will be publishing our full analysis on the new energy price cap figures over the next few days. Subscribe to our blog to automatically receive the following posts by email.
1. An analysis of how different households are impacted by rising energy costs
- Energy bills differ greatly depending on the energy efficiency of the home
- Large households in energy inefficient homes could pay £15,000 in energy costs next year
- Energy bills for large families could be up to nine times greater than for single households in January
2. A full breakdown of the results from our analysis on 114,000 low-income households
- Families with children will be £1,700 worse off on average by April without further support
- The number of households that will not be able to meet their expected monthly costs will double from January
- Almost 1 in 5 single households will not be able to afford all of their essential costs without additional support.