How Revenues and Benefits teams punch above their weight

Deven Ghelani Published on 27th April 2016

Despite greater flexibility to raise income, councils still have to make more savings and ensure their budgets are spent as efficiently as possible. In this article, originally published in the IRRV’s April 2016 Insight magazine, Deven explains how Revenues and Benefits departments can punch above their weight and use their data to improve analytics and insight across the authority – starting with the Chief Executive’s office.
The value of data
As local authorities across the country are being squeezed by ever tighter budget cuts the availability of smarter, cheaper technology continues apace. Senior leaders are searching for high quality, reliable data that can deliver insights to help them do more with less. A recent report from Policy Exchange shows how important data is to policy and strategy teams within local authorities, and how it can help them to make better decisions across the council.
The good news? You already have the data sets. Revenues and Benefits departments have access to some of the most detailed information available on income, employment and poverty. This data has always been available to use and now some authorities are unlocking its full potential.
What is your data saying about you?
Local authority Revenues and Benefits departments are the gatekeepers to hugely detailed data sets on housing benefit and council tax. To outsiders, the language of acronyms like SHBE and CTRS, and the highly technical world of benefits processing, belie a hitherto secret world of laser sharp insights and an inarguable, consistent version of the truth.
The reality is that the unrelenting focus on finding savings and the harsh requirement to make even more cuts puts Revenues and Benefits teams, and the data sets they produce, at the heart of decision making. Policy and strategy teams need to know how this data can be used to deliver improved outcomes, and how targeted, preventative support in a more cost-effective way to fight poverty.
Understanding the true impact of welfare reforms
Since the Welfare Reform Act 2012 Housing and Council Tax Reduction Scheme data has been used by a small number of councils to report on benefits processing and provide important statistics on the impact of welfare policies to policy and strategy teams. Typically, this information has been backward looking, and the impact of policies has been assessed in isolation.
More recently, a revolution in predictive analytics is enabling local authorities to look at the cumulative impact of current and future reforms. We know, for example, that the National Living Wage and increased income tax allowance will have an impact on council tax support payments, but until now we’ve had only a limited ability to model exactly how.
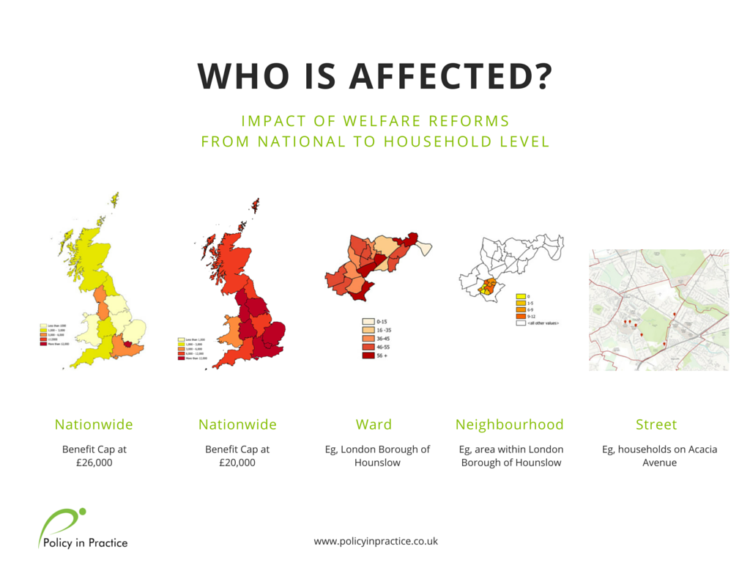
Similarly, local authorities understand the importance of taking mitigating action as a less generous Universal Credit and a higher Benefit Cap loom on the horizon. Some councils are now learning how to unlock their own data to understand which individual households will be impacted, and how.
Speaking at an IRRV conference recently, I was struck by the frustration of people in Revenues and Benefits who wanted information to help them to plan, and were waiting for the DWP to give it to them. Past experience suggests they can be in for a long wait, and even then, the information won’t necessarily give them everything they need.
Together with the Welfare Reform Club, Policy in Practice has worked with a number of local authorities to help them to begin to unlock the power of their benefits data. We worked recently with Bath, Bristol, and others to model prospective council tax support schemes, and helped North Herts to do this, taking into account planned changes to Tax Credits that were, thankfully, reversed. We have helped Birmingham, Hounslow and others to model the impact of Universal Credit, the Benefit Cap and reforms all the way through to 2020.
Yet despite making these strides, we believe we are only just scratching the surface.
Revenues and Benefits should be at the heart of a data-revolution in how we fight poverty
Much more could be done by Revenues and Benefits departments to understand the cumulative and future impact of changes in policy.
The ‘leading lights’ councils we’re working with use our analysis to inform tough decisions. At the strategic level, they’re designing better council tax support schemes, balancing financial and policy priorities, and commissioning support based on the analysis of future impacts.
At the operational level, they’re pinpointing which individual households are at risk of falling further into arrears. They know who will be better off under Universal Credit, or worse off under the Benefit Cap and, where appropriate, supporting those people into work.
For a number of authorities we’re now turning this ‘snapshot’ analysis into a live datafeed that reports monthly or quarterly via an always up-to-date dashboard. The dashboard shows information on how households are impacted now and in the future and, crucially, who they are.
This approach allows these forward-looking local authorities to track the impact of their interventions over time. It can even inform the creation of random controlled trials, whereby interventions are randomly allocated to similar households to see which approach proves more effective.
The ambitious authorities we’re working with are also beginning to combine the insights from their dashboard with other datasets across the council. Linking the impact of welfare reforms with data on council tax and housing arrears has obvious advantages, and can show surprising trends on how DHPs are allocated. Some authorities, notably Haringey, have combined this with data on troubled families, social care and social fund services, to see which households currently receive the most support.
Credit where it’s due
Revenues and Benefits teams own these detailed datasets on income, employment and poverty. In a small number of leading councils they are the powerhouse driving a shift towards data-centric and outcome-focused services, enabling their council to do more – or the same – with less.
By working together and sharing knowledge, through the IRRV, the LGA and Policy in Practice’s own Leading Lights Network, other councils who are not yet doing the same can avoid re-inventing the wheel and build on the good work that’s already happening in this area.