Is Universal Credit getting more people into work?

Janet Harkin Published on 19th November 2018

In the run up to the Autumn 2018 Budget, Universal Credit received significant attention and, in some cases, criticism. Several key figures, including former prime ministers John Major and Gordon Brown, warned that Universal Credit in its then format was not fit for full roll-out, known as managed migration, which is scheduled to begin in July 2019.
In response, Chancellor Hammond announced a raft of changes to Universal Credit in his Autumn Budget. Amongst these was an increase in work allowances for many working families, additional support for households migrating onto Universal Credit and a reduction in the maximum rate at which deductions can be made from an award.
Policy in Practice analysed the impact of the budget changes and found that almost 250,000 low income households would move from being worse off under Universal Credit, compared to legacy benefits, to being better off as a result.
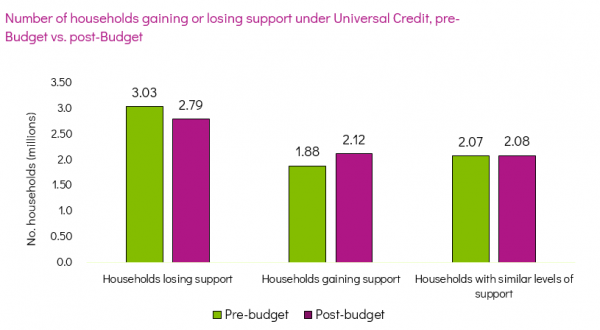
Amost 250,000 low income households gain support under Universal Credit due to Autumn Budget 2018 changes
One area which has received less scrutiny, however, is the impact that Universal Credit has employment. One of the key promises made of Universal Credit is that it is more effective at getting people into work than the old benefits system. Yet not much work has been done to evidence this, with the most recent impact assessment on the employment effects of Universal Credit being published by DWP over a year ago.
Today, Policy in Practice publishes the findings from its own analysis on the employment impact of Universal Credit, carried out using historical household-level data from some of our partner local authorities.
Opportunities to evidence the employment effect of Universal Credit do exist
It is difficult to accurately isolate and measure the employment impact of Universal Credit, not least because the number of people who have received the new benefit for long enough is relatively small and limited. Plus, separating Universal Credit from the range of other factors that can influence somebody’s employment situation is a complex challenge.
That said, with the right data and approach, it is possible to measure the effects of Universal Credit on employment, and how this may vary from area to area. The IFS advise that the best approach to reliably measure the employment impact of Universal Credit is through the use of longitudinal household-level data.
Policy in Practice was recently commissioned by the Local Government Association to do this with household-level data from three of our partner local authorities: Newcastle City Council, London Borough of Tower Hamlets and Great Yarmouth Borough Council. At least one Jobcentre Plus in each of these areas has offered full-service Universal Credit for some time, creating a large enough sample size to carry out this analysis. Ahead, we present the key findings from our report, The impact of Universal Credit on employment outcomes: methodological note & findings, published today.
Download The impact of Universal Credit on employment outcomes report here
Our approach: tracking the outcomes of individual households over time
Our analysis used administrative datasets collected by the three participating local authorities on every household claiming either Housing Benefit or Council Tax Reduction. Households that move onto Universal Credit stop claiming Housing Benefit, but are in many cases still eligible for Council Tax Reduction and therefore remain visible to authorities.
Both datasets were collected over a number of months, before and after Universal Credit became available in that particular area.
In order to determine whether there is a statistical relationship between Universal Credit and better employment outcomes, we tracked how the employment rate of Universal Credit claimants changed over time, and compared their outcomes three months later against a similar cohort of households on legacy benefits.
Three different approaches to measuring the relationship between Universal Credit and employment were tested. In all three approaches, households claiming Universal Credit were identified as the treatment group, whilst households claiming legacy benefits under the same circumstances just before Universal Credit became available were assigned to the control group.
The three approaches differ in what types of Universal Credit claims were sorted into treatment/control groups:
- Approach 1: claims triggered by change in circumstances. We measured the employment outcomes of people who went onto Universal Credit through triggering change in circumstances, and compared these to the outcomes of people that had the same change before Universal Credit was available in that area.
- Approach 2: new claims only. We measured the employment outcomes of people who made a new claim for Universal Credit, and compared these to the outcomes of people making a new (legacy benefits) claim before Universal Credit was available in that area.
- Approach 3: UC versus non UC postcodes. We compared how employment rates change in postcodes where Universal Credit full-service was available to the change observed in postcodes where, at the same stage, it was not yet available.
Findings: there is some evidence that Universal Credit has a small positive impact on employment
Our findings indicate that Universal Credit does not have a conclusive impact on employment – although any impact is more likely to be positive than negative.

Table 1.2: Estimates for impact of Universal Credit on employment under three approaches taken
The table above shows the estimated impact of each approach on Universal Credit, in terms of how the employment rate of the population changed after three months. The core limitation is that our observations for households on Universal Credit is limited to those claiming council tax support.
For approaches 1 and 2, we calculated these estimates under three scenarios. This is done in order to account for households that leave the datasets at some point after the first month in the sample, which could be either because these households find work, or because they stop claiming CTR for another reason, such as moving.
In scenario A, we assume that all households that drop out do so because they have found work, whereas scenario B excludes these ‘drop-outs’ from the control and treatment groups.
- Approach 1 does not provide conclusive evidence that the employment impact of Universal Credit is positive. Employment rates increase by 0.3 under scenario A and 0.9 percentage points in scenario B. However, under both scenarios the true impact of Universal Credit on employment rates could in fact be negative, and lead to reductions in the employment rates of up to 2.5%.
- Approach 2, meanwhile, provides more evidence that the impact of Universal Credit on employment rates is positive. Under scenario A, it can be concluded that the impact is positive, whereas under scenario B the true effect could be a reduction in employment rates of 3% or as high as 7%s.
- Approach 3 shows Universal Credit having a positive impact on employment rates. The benefit was responsible for increasing the employment rate of the population by 0.7%, and it can be statistically ruled out that the true effect is negative.
So, does Universal Credit fulfil its intent to get more people into work?
From our current analysis we conclude that Universal Credit does not appear to have a statistically significant impact on employment rates. That said, there is more evidence that any significant impact is more likely to be positive rather than negative.
It should be noted, however, that this analysis focused on data from three local authorities, and is based on households that are claiming CTR. The evaluation of Universal Credit and its impact on employment should be done on a larger scale and over a longer stretch of time before making further conclusions.
The National Audit Office, in its evaluation of Universal Credit published this June, also raised the importance of the DWP measuring whether Universal Credit is meeting its stated goals around employment. At the very least, our analysis shows that administrative data at the household level can be used to do this. The DWP continuing to make this data available as Universal Credit rolls out is therefore key.
The impact of Universal Credit will look very different locally
Irrespective of the national impact of Universal Credit, it is clear that its effects will not be universal across the country.
Our own analysis from the Family Resources Survey, for example, shows that whilst 29% of households eligible to receive Universal Credit in Greater London will be worse off, in the South West of England this figure will be 47%. Regions and local authorities in the UK have very different demographics, which determine the impact Universal Credit will have on its residents and their employment patterns.

% of households in England worse off under Universal Credit, by region
Delving deeper, local authorities can use their administrative data to see what their local picture will look like once Universal Credit is fully rolled out. These insights help councils understand which types of households are expected to be worst off under Universal Credit, and enable evidence based strategies to be devised to proactively target support to the most vulnerable groups.

Figure 1.4: The overall impact of Universal Credit in a particular local authority.
Further information
Find out more about how Policy in Practice helps councils use their data to understand and anticipate the local impacts of Universal Credit here.
Download our analysis of the impacts of Autumn Budget 2018 here.
Join our final webinar of 2018 on Wednesday 11 December where we look back at the key social policy themes we analysed for clients in 2018, and what our results mean for 2019. Find out more and register here.