Housing benefit reforms: the impact on Towns, Cities and London Boroughs

Janet Harkin Published on 09th June 2016

In our National Picture of Welfare Reform series we share what we’ve learnt about the impacts of different welfare reforms. Our analysis is based on household-level data from local authorities that has been anonymised, aggregated and analysed for London Boroughs, Big Cities and Small Cities and Towns.
The first blog introduced our analysis on the National Picture of Welfare Reform and, in the second post, we focused on the varying impact of Universal Credit nationwide. In the third post we looked in more detail at the impact of the Benefit Cap and finally, in this post, we focus on housing benefit reforms.
Our household level impact assessment service helps local authorities to assess the cumulative impact of reforms, and target preventative support to identified households, to learn more click here.
The rationale for Government intervention
Two welfare reforms in the Government’s programme have had a particular effect on housing benefit, namely the Under-Occupancy Charge (UOC, commonly known as the Bedroom Tax) and the Local Housing Allowance (LHA) cap.
The LHA cap was introduced in 2008 and affects private tenants. It limits housing benefit payments to the value of the thirtieth percentile of rents in a local authority. Originally introduced at the fiftieth percentile, it was lowered to the current level in 2013.
The UOC was introduced in April 2013 and affects social tenants. Households with more bedrooms than deemed necessary for the needs of the occupants will have their housing benefit cut by 14% (for one extra bedroom) or 25% (two or more extra bedrooms).
In 2010 the coalition Government gave two key reasons for introducing size criteria and associated limitations in housing benefit entitlement in the social rented sector: the need to reduce expenditure on Housing Benefit, and the desire to secure behaviour changes amongst social housing tenants.
However, Policy in Practice’s analysis finds that the ability to empower tenants is limited by market forces, which ultimately drive the impact of these twin reforms.
Understanding the impact of the Under-Occupancy Charge
Unsurprisingly, the under-occupancy charge impacts most significantly on areas with a high proportion of working-age social tenants. In our analysis, two most affected authorities have the second and third highest levels of social tenants respectively, whilst London Boroughs, with the lowest levels of social tenants, are three of the four local authorities least affected by the UOC.

The availability of social housing drives the impact of the UOC. Current housing stocks do not adequately meet the needs of social tenants.
“We have a real issue with multi-storey flats. We tend not to put families in there with children because we don’t think it’s the right environment for them. So we tend to let to childless couples or single children, and they’re almost all two bedroom flats, so they’re almost all affected by under-occupancy.” A Big City local authority client
As demand increases, mis-allocation grows, and the impact of the UOC is greater in areas with higher levels of social renters.
The government has committed to reducing social rents by 1% per year for the next four years, and our investigation into this reform shortly after its announcement found that its main impact will be diminishing rental income for local authorities. This will hinder local authorities’ ability to supply the necessary, affordable homes to meet the needs of the UOC.
The Local Housing Allowance Cap
High and rising rental prices in the private rental market drive the impact of the LHA cap. High-cost private rental properties means fewer affordable homes for low-income households, and more low-income households with high rental costs, above the LHA cap.
Smaller private rental markets are particularly susceptible to this. The three local authorities with the lowest levels of private tenants are all Small Cities and Towns, proportionally, they are the first, second, and fourth most affected by the LHA cap. Overall, the correlation between the size of the private market and the LHA cap’s impact is stark, albeit consistent.
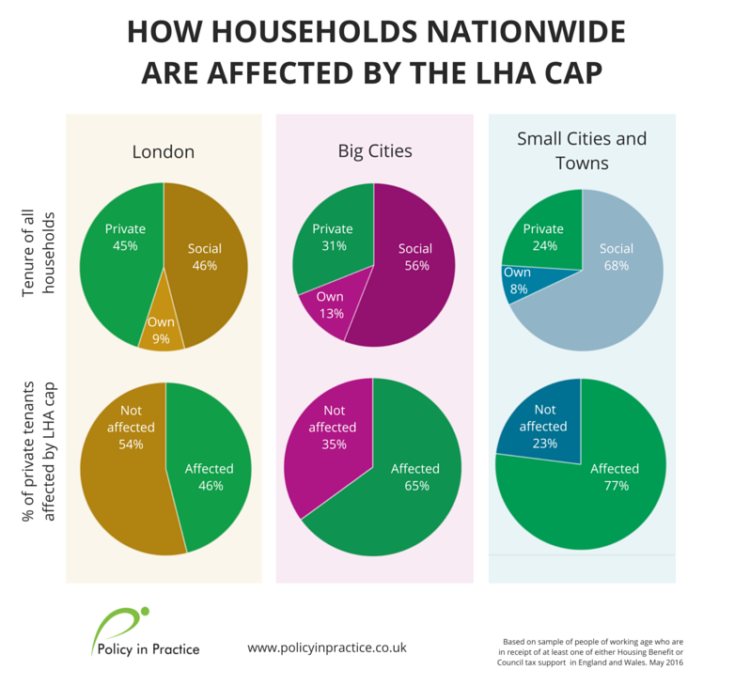 London Boroughs have the highest level of private tenants, and are generally least affected by LHA rates.
Given that London has a higher proportion of private renters, this may indicate a better supply and distribution in the private market here than in smaller private rental markets, where low-income households lack choice, and are forced to pay higher prices.
It will be very difficult for local authorities to control what will happen in these markets in the coming years, but being able to identify those households most likely to be hit is a crucial first step.
Finding solutions for tenants
The social sector, over which local authorities and housing associations retain control, is where the most powerful support systems can be developed. Most local authorities lack the resources to build many of new homes; thus practical solutions must be found to mitigate the impacts of both of these reforms.
“We know that under-occupancy (charge) is here until at least 2020. We are seeing that the numbers are not reducing because we don’t have the accommodation for people to move into. So the only option is to make it easier for those people to pay the rent.” A Big City local authority client
Local authorities tell us that many of the solutions are improvised, but that finding ways to engage tenants and work proactively with them to provide practical, mutually beneficial support have a positive impact. The key steps are to:
- Identify affected households
- Determine their barriers, whether employment, budgeting, skills or financial support is required
- Develop schemes schemes that respond to tenant needs
Case Study:
One local authority client, after finding out that it was particularly affected by the UOC (20% more households affected than the national average), developed a pilot ‘social contract’ scheme. This was targeted at childless households which were affected by the UOC but who weren’t a priority for a discretionary housing payment (DHP), which covers the UOC.
The council’s intention was to secure behavioural change from the residents. They did this by providing a DHP to residents who engaged with the Council in activities to improve their situation (such as looking for work or volunteering locally).
The results of the scheme were described as an ‘absolute sensation’, with the council engaging with people they hadn’t heard from for years. From the residents’ point of view, 86% of participants said that the scheme had made a ‘very positive improvement’ to their lives.
Behavioural change schemes such as this are easier to execute with social tenants, where more data is available and relationships between tenants and local authorities are closer.
Find out more
Policy in Practice can model the financial impact on people in the private rented and social rented sectors, to understand how they are affected by reforms, as a first step to engaging them. We’re keen to work with local authorities and housing associations, and we welcome feedback from their experiences, in order to provide better support to these vulnerable households in the private sector.
- Read the previous blogs in our National Picture of Welfare Reform series:
- Welfare Reform: comparing the impacts on London, big cities and small towns
- Universal Credit: the impact across London Boroughs, Big Cities and Small Cities and Towns
- The Benefit Cap: the varied impact on London, Cities and Towns
2. Request our eBook A Postcode Lottery? The National Picture of Welfare Reform here.
3. Request pricing details for a welfare reform impact analysis to show how individual households in your area are affected now, and in the future, by welfare reforms.


