New analysis: How disability benefits changes will affect your local area

Disability benefits changes: the local impact revealed
Last week we published headline findings on the expected impact of disability benefit reforms, highlighting the removal of the Work Capability Assessment and the likely knock on effects for councils and the NHS.
In this follow up article we dig deeper into the details to reveal how the disability benefits changes are expected to affect individual regions and local authorities across the UK.
Local authority and council leaders need to understand how people in their areas will be affected, both to prepare for rising service demand and to protect the people most at risk. This analysis answers those questions. We’ve broken down the expected human and economic impact in every local authority, showing just how unevenly the effects will be felt.
We find that:
- The hardest hit regions of the North East, Wales and the North West face over three times the economic impact and twice as many affected residents, compared to London and the South East
- The 10 most impacted councils face economic costs around five times the national average
Meanwhile, innovative councils are acting now to help disabled residents secure Personal Independent Payments (PIP) before the reforms take effect, mitigating future risks and costs.
Our findings suggest that, while the reforms are intended to save money nationally, the costs may shift to local services, reducing overall savings.
Local authority and NHS leaders can receive local analysis and an action plan from our team.
The national picture: findings on disability benefits changes
We find that the disability reforms will affect around 2.9 million people who could lose a combined £6.8 billion.
We have modelled the main changes, plus some additional ones not included by the OBR, and adapted them to the local authority level, meaning our figures don’t exactly mirror the estimates in the Spring Statement 2025.
We find that by end of this parliament:
- 800,000 people are expected to lose PIP worth between £3,800 and £5,700
- 1.7 million people currently on LCWRA will be impacted by the freeze, worth over £500 per year each in real terms, by 2029
- 440,000 new recipients of LCWRA are set to be awarded half the current value, losing £47 per week, or £2,450 per year
- 230,000 people could lose both PIP and LCWRA. Combined, these households could lose over £9,000 per year. The loss of PIP is accounted for in the first bullet point, but the loss of LCWRA is worth £97 per week or £5,000 per year.
A recent freedom of information request suggested that almost nine in ten people (87%) getting the PIP standard daily living amount and one in ten (13%) people getting the enhanced award (13%) will score less than four points across all ten daily living activities. These figures do not include the impact on the support that carers currently receive. See the end of this blog to learn how we calculated our numbers.
People losing out on disability benefits will find it harder to access care and support services. As a minimum, we argue that people who, on losing eligibility for PIP who claim or become eligible for Universal Credit, should be able to access the health element.
The regional and local picture: findings on disability benefit reforms
While the overall impact of these reforms is significant, a closer look at regional and local data shows that the effects are not evenly distributed across Great Britain.
We found that the regions with the highest proportion of affected people and the largest financial impact are the North East, Wales and the North West.
Our analysis showed that in:
- North East England nearly 170,000 people will be affected, 6.2% of the population, with £400 million lost
- Wales nearly 190,000 people will be affected, 6.1% of the population, with £470 million lost
- North West England nearly 430,000 people will be affected, 5.7% of the population, with over £1 billion lost
Overall, around 45 in every 1,000 people are expected to be impacted. In the hardest hit regions, this figure can be up to 1.3 times higher at 62 per 1,000 people.
A similar but more pronounced pattern emerges when analysing the financial impact. While the national average impact of the reforms is around one third of one percent of the total economy, measured as the Gross Value Added (GVA), the same three regions see impacts that are roughly twice as high.
| Region | Financial impact (£m) | Financial impact (% GVA) | People affected (000s) | People affected (per 1,000 inhabitants) |
|---|---|---|---|---|
| North East | £400 | 0.64% | 170 | 62 |
| Wales | £470 | 0.63% | 190 | 61 |
| North West | £1,020 | 0.47% | 430 | 57 |
| Yorkshire and Humber | £690 | 0.45% | 290 | 52 |
| West Midlands | £670 | 0.42% | 280 | 46 |
| East Midlands | £520 | 0.40% | 210 | 43 |
| South West | £540 | 0.31% | 230 | 40 |
| East of England | £560 | 0.30% | 230 | 37 |
| Scotland | £470 | 0.28% | 250 | 46 |
| South East | £710 | 0.21% | 300 | 32 |
| London | £820 | 0.16% | 360 | 41 |
| Great Britain | £6,870 | 0.31% | 2,940 | 45 |
Table 1: Regional impact of disability benefit reforms
Looking more closely at the local authority level, the disparities become even more pronounced. While our analysis indicates particularly high impacts in some local authorities which may warrant further examination, the three most affected regions also show the greatest variation.
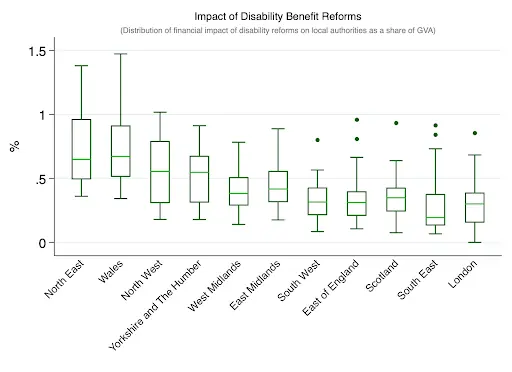
Figure 1 shows the distribution of the financial impact across local authorities by region and illustrates that, in most regions, the impact for all local authorities remains below 1% of their local GVA. The exceptions are the North East, Wales and the North West, where at least half the local authorities experience an impact greater than 0.5% of their GVA.

Among the 10 most affected local authorities, nine are located in the North East, Wales and the North West. In these areas, the financial impact as a share of GVA can be up to five times higher than the national average.
Additionally, in these same areas, the number of people affected per 1,000 inhabitants can be twice as high as the national average.
| Local authority | Financial impact (£m) | Financial impact (% GVA) | People affected (000s) | People affected (per 1,000 inhabitants) |
|---|---|---|---|---|
| Blaenau Gwent | 15 | 1.47% | 6 | 93 |
| Hartlepool | 20 | 1.38% | 9 | 93 |
| South Tyneside | 25 | 1.28% | 10 | 67 |
| Merthyr Tydfil | 10 | 1.15% | 5 | 84 |
| Redcar and Cleveland | 20 | 1.09% | 9 | 67 |
| Neath Port Talbot | 30 | 1.04% | 12 | 84 |
| St. Helens | 30 | 1.02% | 13 | 68 |
| Caerphilly | 35 | 1.01% | 13 | 77 |
| Tendring | 20 | 0.96% | 9 | 58 |
| Blackpool | 30 | 0.95% | 13 | 93 |
Table 2: Ten most impacted local authorities
Together this means that deprived areas that have more people on disability benefits who risk losing out also see a greater proportionate impact – impact that hits an already struggling local economy. These reforms will work against efforts to level up local economies unless the cuts to disability benefits are replaced by other forms of investment.
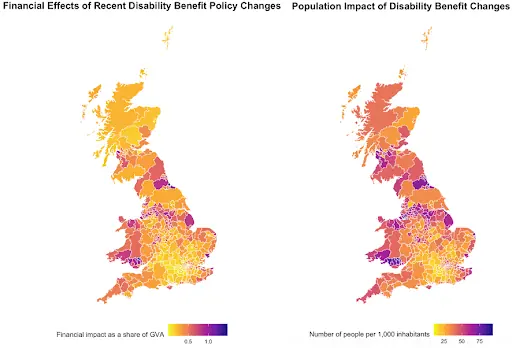
The financial and human impact on each local authority is shown in the charts below, with darker areas showing the most heavily impacted local authorities.

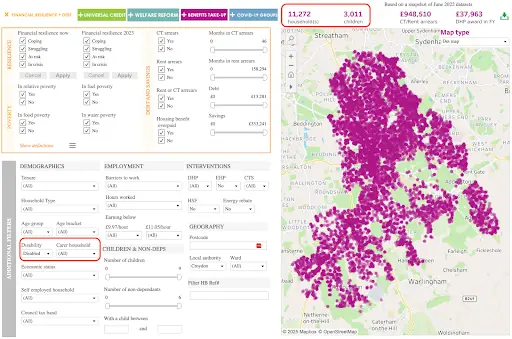
You can see high impacts in coastal areas, outliers within better off regions and differences between people impacted and the resilience of the local economy. Each local authority should seek to understand both the aggregate impact, and the individual impact on households within their local authority. Policy in Practice’s LIFT platform can help local authorities to identify households with LCWRA, PIP or caring responsibilities.

Actions that local authorities and combined authorities can take now
Policy in Practice knows that many people with disabilities are worried about these changes. Those who are set to be most heavily impacted could lose over £9,000 per year, and find it harder to access care and support services.
We are calling on the government to allow people who lose PIP due to not scoring four points in any one category to retain the health element if they go on to qualify for Universal Credit.
Local authorities we work with are particularly interested in what they can do to make a difference today, to support people and mitigate some of the impacts of these changes on residents’ growing demand for local authority funded social care support. It’s important to reassure people that reforms aren’t coming in immediately, while helping people to access the right support.
Below are some examples of what is being implemented using LIFT data and the Better Off Calculator today that you can consider:
- Use LIFT to identify households that are on LCWRA but not PIP, and support them to claim PIP as soon as possible so that they are protected when these changes come into effect
- Use LIFT to support households to take up Pension Credit and Attendance Allowance. This can support people to live independently for longer and reduce social care pressures from older people, to mitigate the expected increase in demand from those of working age
- Use the Better Off Calculator to assess the impact on social care funding, modelling citizen and local authority contributions at scale against multiple scenarios now and in future years.
LIFT can identify around half of the cohort on LCW, typically those on the lowest incomes, and a similar proportion on PIP although this can vary according to the local authorities CTR scheme and benefits system provider.
A number of local authorities are also bringing data on social care costs and debts into the LIFT platform, and we expect LIFT coverage to grow as DWP agrees to share more data on people in receipt of Universal Credit. A growing number of local authorities are licensing the Better Off Calculator for their social care teams, who use it to encourage people to access the support they should already be receiving.
Our Better Off platform can help you to assess the likely impact on social care costs, or help people considering employment support to see that they can be better off in work.
Tools like MAST bring data together across services to help national and local government understand the knock on impacts of changes in both policy and practice. Analysis like this that shows the impacts on your local authority can be broken down further to show the year on year impacts, impacts by age group, and who stands to lose out the most.
Perhaps most importantly, this analysis will help councils, other local organisations and individuals to better understand and quantify the wide ranging impact of these proposals so they can make representations both within and outside the consultation framework to ensure sufficient and sensible amendments are introduced.
Next steps
- Join our webinar: Understanding the impact of disability benefits reforms on local authorities, Wednesday 27 August. Register here
- Request more analysis: For detailed modelling on the annual impacts of each of these reforms or other disability benefits analysis email hello@policyinpractice.co.uk
- Read our previous blogs on disability benefits reforms:
The impact of planned disability reforms on local authorities and the NHS
Supporting residents through disability benefit changes: what you need to know
Reforming benefits and support to get Britain working: what the changes to sickness and disability benefits mean
Methodology: How we calculated our numbers
We allocated the number of people losing the PIP daily living component, estimated by the OBR, proportionally across local authorities, based on the population entitled to PIP in January 2025 (or the ADP in Scotland). To estimate the financial impact, we then applied the average weighted payment of the standard and enhanced allowances, annualised.
To estimate the loss resulting from the freeze in the award, we calculated the foregone increase in payments based on projected inflation over the next four years. We then applied this to the total LCWRA caseload in each local authority.
To estimate new claims for the health element of Universal Credit (UC), we used the forecast published by DWP. New claims were calculated as the annual change in the total number of people projected to be claiming LCWRA in UC by the end of each year, plus off-flows, which were estimated at 1.2% of the total caseload annually. The resulting number of new claims was then proportionally allocated to each local authority, based on the number of households claiming LCW or LCWRA in November 2024.
This analysis assumes that people who no longer qualify for PIP would also no longer qualify for LCWRA. According to DWP data, around 30% of PIP recipients would have qualified for the LCWRA element of Universal Credit. To estimate the number of people who will lose the health element of UC as a result of losing PIP, we applied this proportion to the total number of people expected to lose the PIP daily living component. We then allocated this total proportionally across local authorities, based on the number of households claiming LCW or LCWRA in November 2024. Finally, to estimate the total financial support lost, we have applied the £97 weekly award on an annual basis.
To compare values across different regions, we normalise the financial impact by the Gross Value Added (GVA) of each local authority and the number of people affected by their respective population, both figures published by the ONS.
The number of people and the financial impact at the regional level were rounded to the nearest £10 million. At the local authority level, the financial impact was also rounded to the nearest £10 million, while the population was rounded by 1,000.


