How has the Benefit Cap affected Londoners?

Giovanni Tonutti Published on 26th March 2018

Policy in Practice has recently concluded Phase Two of the Low-income Londoners and Welfare Reform project. Funded by Trust for London, this work pools Housing Benefit and Council Tax Support data across different London Boroughs, in order to track how the income, employment and housing circumstances of low-income Londoners change over 24 months.
In this blog we provide a summary of the Phase Two findings, focusing on the effect of the benefit cap in the capital. We ask whether the policy has achieved the key objectives set out by the DWP, namely to increase employment and lower costs.
This analysis was covered in The Evening Standard on Monday 26 March 2018. Read the news release here
Collaborative data sharing from London councils
Nineteen London boroughs have shared their data to date, allowing us to track over 574,000 households over the course of 19 months.

Published in July 2017, the first set of findings gave an overview of the living standards of low-income Londoners. Building on this work, Phase Two sought to address a different set of more complex questions.
Bigger data set allows more in depth analysis
In Phase Two the focus of our analysis has moved on from the broad low-income population to specific subsets of households, namely households affected by the benefit cap or the self-employed. The sheer scale of the study allows such in depth analysis: a sample of 574,000 households means that subsets are large enough to yield meaningful conclusions. Neither survey data, such as the Family Resources survey, or individual local authorities acting alone, would be able to yield the detailed insights made possible by combining multiple household level data sets.
The analysis also tries to unravel the causal relationship linking the effects of government policies to the behavioural responses of households affected. The longitudinal nature of the dataset that allows us to differentiate between causation and correlation. We track each household on a monthly basis to see how one change, for example the benefit cap, may impact on another, for example employment.
How has the benefit cap affected Londoners?
In November 2016, the benefit cap was lowered to £23,000 per year for families, and to £15,410 for single households living in greater London, with the intention of reducing welfare expenditure and incentivise people into work. The 10 week roll-out was concluded in February 2017.
Demography: people most impacted
By July 2017 the impact of the cap meant:
- 8,828 households see an average reduction in their Housing Benefit entitlements of £60 per week
- 24% (2,083) of affected households are single-person households
- 79% (7,000) are households with children
- 18,362 children live in households affected by the cap
The majority of households affected are lone parents (62%), and a significant proportion are employed (13%). Over half of all families affected live in the private rented sector (52%), and a further 18% are housed either in temporary or emergency accommodation.
Geography: places most impacted
Brent, Hackney and Ealing are the London boroughs most heavily impacted both in terms of the absolute number of capped households and in the proportion of the overall population affected by the policy (1% ca).
The wards with the highest number of households capped are Harlesden, East Acton, Stonebridge, Dollis Hill, all counting over 90 families affected.
Regional and local policy-makers should note how the wards and neighbourhoods most heavily impacted by the benefit cap tend to cluster around areas crossing borough boundaries. These areas can be defined as sub regional areas of deprivation, as shown on the map below.
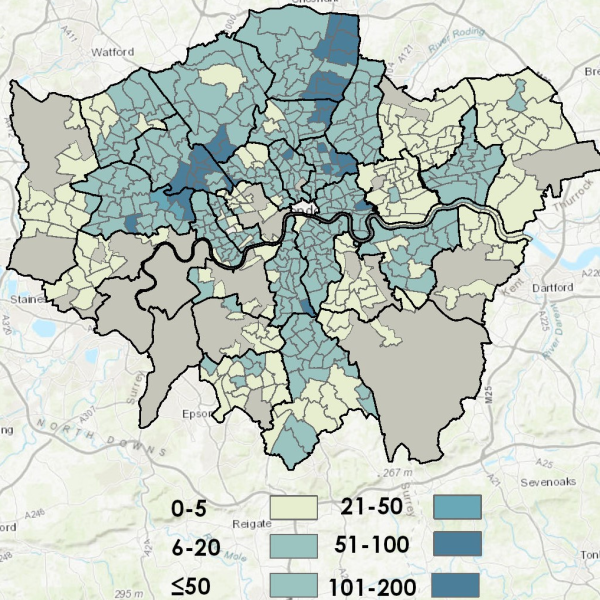
Sub areas of deprivation exist over local authority boundary lines
The existence of these sub regional areas of deprivation highlight the importance of collaboration across local authorities boundaries. Neighbouring councils face similar challenges and should co-ordinate activities and efforts together to successfully tackle them.
The dynamic effects of the benefit cap
Pooling monthly benefit data allows us to track the impact that this policy has had longitudinally. Five months after the roll out of the lower cap, which was completed in February 2017, we observe a considerable drop in the caseload of impacted households. From a maximum of 11,413 households affected by this policy, the data show a decreasing trend, falling to a total of 8,828 households, equivalent to a 23% drop in caseload.
This trend is in stark contrast with what recorded at the national level, where, within the same time period, the total number of households affected by the benefit cap has actually increased slightly, starting to drop only after August 2017. Below we explore the potential drivers behind this.
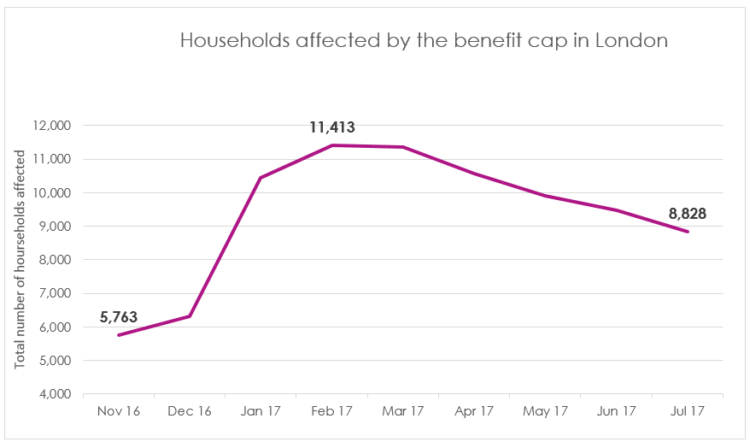
5 months after the benefit cap roll-out ended there was a 23% drop in claims
Because the data is at a household-level we can track how the circumstances of individual families have changed since the policy came into effect. In other words, by analysing how people who were affected by the cap responded, we can provide an assessment of the dynamic effects of this policy.
Since the lower benefit cap was introduced in London in November 2016 our data model shows that 5,211 households have been able to successfully move off the cap and are no longer affected. Of this group we have identified three main sub-groups:
- 37% moved off the cap by taking up a job, or by increasing their hours worked
- 29% avoided a reduction in their benefit entitlement by moving property
- 28% are no longer present in the data-set
People who moved into work
A closer look at the first sub-group shows that the vast majority of households who have moved into work are lone parents with school-age children, while single people are significantly less likely to move into work once affected by the cap. This is most likely due to the large proportion (48%) of single capped households in receipt of ESA. Such findings are aligned with previous research conducted by Policy in Practice and others, highlighting how childcare represents less of a barrier to employment than the presence of illness, poor mental health and disability.
People who moved home
Within the second sub-group of families who have moved home in order to escape the cap, 70% of these households changed address but stayed within the same London borough. By contrast, 26% of households were moved into temporary accommodation in another London borough and a further 4% were placed in temporary accomodation outside Greater London.
People who left the data set
Little information is available on the sub-group of families who, following being capped, are no longer present in the data-model. These are (in order of likelihood) households who have re-located outside of London independently (but might well continue to be affected by the benefit cap), families who have started claiming Universal Credit, or households who have moved into work and no longer claim housing benefits.
The impact of the benefit cap on employment
Our analysis shows that a significant proportion of households were able to move into work – one of the stated intentions of the benefit cap policy.
However, this information alone does not provide a definitive answer to one of the key questions this project seeks to address, namely: has the introduction of the benefit cap incentivised families to move into employment, or has it pushed them into high cost temporary accommodation?
To answer this question, the analysis needed to isolate the single effect of the policy on employment outcomes from other factors which might play a role, such as a general increase in employment figures.
The method we used involved sampling two groups: the treatment and control groups. The analysis looked at changes in employment rates among those families affected by the cap before and after the introduction of the policy (the treatment group), and compared this with those of households with similar demographic characteristics not subject to the policy (control group).
We applied this method (Difference in Difference Regression model) to our data and obtained a statistically significant outcome at a 95% confidence interval.
The findings show a higher variation in employment figures among households subject to the policy compared to the same indicator in the control group. While this difference is low (3.5%), it is significant and does indicate that the benefit cap has played a role in these families moving into work.
What this analysis doesn’t capture, but our work with local authorities affected by the benefit cap clearly shows, is the critical work that goes into supporting families affected by the policy into work, and in helping them to sustain a tenancy, which plays such an important role in these findings.
The human costs of the benefit cap
Alongside the positive impact the policy has had on employment outcomes, our analysis also highlights significant associated human costs. The introduction of the cap risks bringing a considerable deterioration in the living standards of affected households.
For many people affected by this policy, such as those in receipt of ESA or single parents with children below the age of three, work may not be a feasible option.
In London, the findings are unequivocal:
- 293 households affected by the cap moved into temporary accommodation
- 1,825 children and 737 families have fallen into relative poverty due to their reduction in their benefits entitlements
- 417 households saw their income fall below their modelled expenses, putting them at financial risk
Local authorities are often left plugging the gap created by changes to the benefits rules and necessarily provide a safety net for their most vulnerable and disadvantaged residents, albeit with ever shrinking budgets and limited resources.
In order for the policy to continue to meet its objective of improving work incentives while limiting the collateral damage on the pockets and prospects of low-income households, the DWP may need to consider applying the cap only to those households subject to active conditionality regime.
In line with this argument, a recent High Court judgment ruled against the application of the policy to lone parents with children below the age of two. The ruling could be added into the DWP’s own regulations.
Data analytics can help deliver better social outcomes
This blog post provides a summary of the preliminary findings of Policy in Practice’s analysis on the impact of the benefit cap in London. A more extended briefing on this topic will be published in the ‘Low-income Londoners and Welfare Reform’ final report, in May 2018.

Analysing administrative data has huge potential for local government
In addition to the important and revealing findings of the analysis, our Low Income Londoners project has also showcased the huge potential that administrative data holds in improving social policy outcomes.
Moving on from a purely descriptive approach, the analysis of longitudinal household-level data has unravelled the causal link between government policies and citizens’ behavioural outcomes. The implications of this are vast for the way social policy can be designed and delivered, both at a national and regional level.
Systematic analysis of administrative data offers the key to evidencing the effectiveness of interventions, and the insights gained help policy makers with their decisions. Policy in Practice is engaging with the DWP, the Greater London Authority and over 50 local authorities across the country to promote the use of administrative data as a way of improving social outcomes.
Find out more
- Read Phase Two findings summary report here
- If you are a London Borough and would like to be involved in the final phase of this fully funded project please email giovanni@policyinpractice.co.uk as soon as possible.


