Cost of living crisis: Low income families with children set to be £1,683 worse off this winter

Tylor-Maria Johnson Published on 07th September 2022

The cost of living crisis is set to hit people hard this winter as both fuel bills and inflation rise.
We find that the average low income family with children will see their take home income fall by a total of £1,683 from October 2022 to April 2023 without additional support. Lone parents will also see their income fall by £1,074 and single households by £560.
This final blog in our four part series on the cost of living crisis shows new analysis from Policy in Practice that forecasts the impact of rising inflation and the energy price cap on over 114,000 low income households.
Support with the cost of living is needed for everyone but should target people most in need
The new prime minister must recognise that the current inflationary pressures affect low income households differently. Being ready to lead requires a commitment to addressing the variations of needs for those at the cutting edge of the cost of living crisis. Flat rate support is not enough to prevent all vulnerable households from falling into fuel poverty, or negative budgets. The most effective way to deliver targeted support is by uprating Universal Credit and legacy benefits.
Differences in household composition create differences in household needs
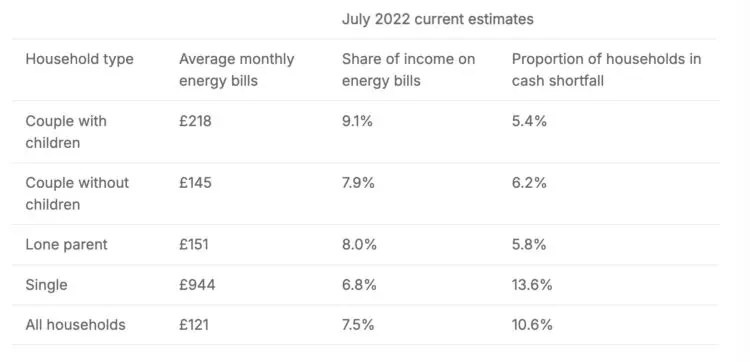
Different household types experience inflationary pressures in different ways. In July 2022, soaring energy costs put a large strain on couples with children. These households currently spend 9.1% of their income on monthly energy bills of about £218. Compared to other household types, couples with children spend the largest share of their monthly income on energy bills. Yet, these families benefited less per person from the flat rate payments announced in May than smaller households.
Our analysis also finds that single households on a low income are particularly impacted by rising costs. About 13.6% of single households had negative incomes after essential costs like food, water, or clothing.
Under the current inflationary pressures, all low income households have begun to feel the pinch of rising household costs. Different households feel these inflationary pressures in different ways because of their household characteristics. These variations are likely to be exacerbated in the autumn as costs rise further.
Administrative data forecasts the impact of rising costs for 114,000 low income households
This analysis samples from over 114,000 low income households on Housing Benefit and/or Council Tax Support in six local authorities across different regions in the UK from July 2022. Administrative data provides detailed information on household demographics, near real-time, covering a large population size.
Specifically, this analysis shows:
- Energy bills will be up to nine times higher for larger families
- Single households won’t have enough money to meet essential costs in October 2022. Couples with children will see the highest monthly energy bill
- Average low income household would need £806 more to meet rising costs by April 2023
Energy bills will be up to nine times higher for larger families
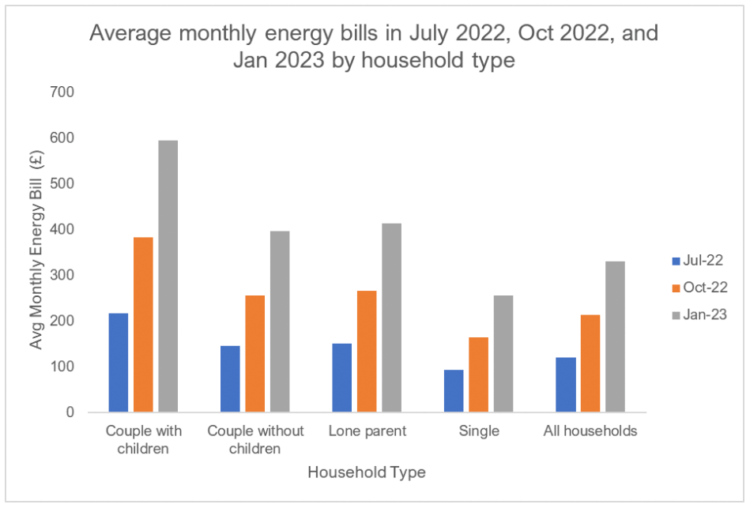
By January 2023, we find that the average low income couple with children will see energy bills as high as £595 per month, as shown in the bar chart above. This compares to single households which will see their energy bills grow to £256 per month.
In a previous blog, we found that large households could pay up to nine times more than single households in January 2023. This is because the amount that a household will pay will vary depending on the size of the property, the property’s energy efficiency, whether the bill is paid by direct debit or is prepaid, and the household usage of gas and electricity.
Single households won’t have enough money to meet essential costs in October and couples with children will see the highest monthly energy bills
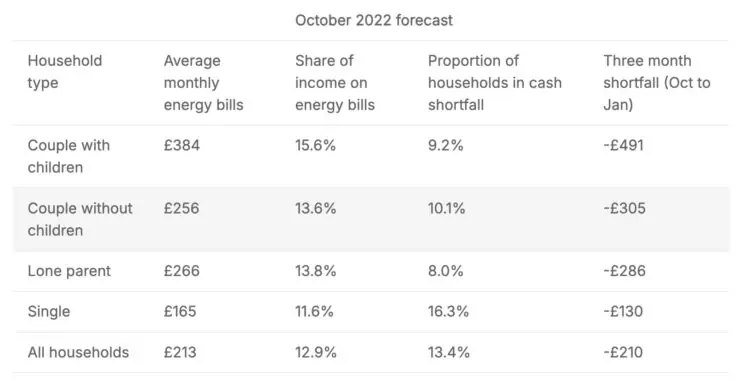
By October 2022 the average low income household will be in fuel poverty, spending more than 10% of their income on energy bills. This is particularly the case for couples with children.
We estimate that larger families will spend an average of 15.6% of their income on energy bills. Their increased spending on energy is likely due to their larger household size, and having larger properties. Lone parents will also spend an average of 13.8% on energy bills, and single households will spend an average of 11.6%.
The combined impact of rising energy bills and inflation are drivers for greater financial strain, especially for single households. Generally, single households are likely to have a reduced capability to meet rising essential costs without making additional cuts due to their smaller household size. By October, 16.3% of single households will be in negative budgets. This is when their income is not enough to cover essential costs, like clothing, food, or water.
From October to January low income households would need an additional £209 on average to maintain their real level of income from July, factoring in the £400 energy rebate announced in May this year. This amount varies by household type. Larger families would need £491 more, which is almost four times the amount needed to counter the rise in costs for single households.
The patterns highlighted in this demographic analysis show that flat rate support has a diminishing impact on energy bills as family size increases. It also suggests that smaller households need targeted support to encourage greater financial resilience.
Average low income household would need an additional £806 to meet rising costs by April 2023
The combined impact of inflation and January’s energy price cap rise, including the May support package, could mean a challenging winter for low income families if further support is not announced.
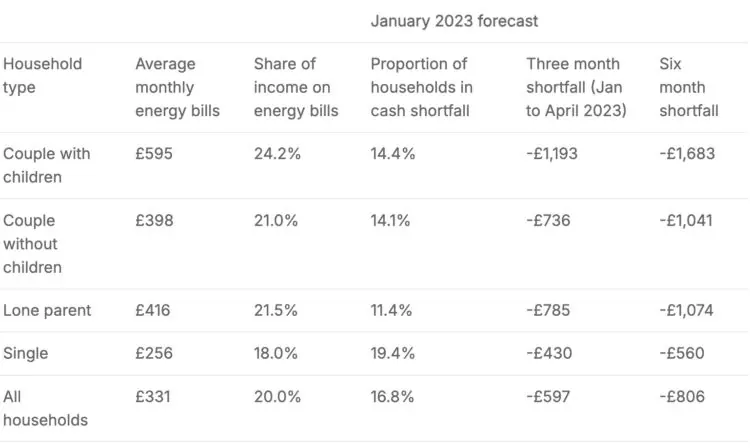
From January to April 2023, the average low income household could see their take home income decrease by an additional £597.
Taking into account October’s changes, the average low income family would need an additional £806 by April 2023 to maintain their real level income from July 2022. Couples with children will need £1683 on average to maintain their original income levels. Lone parents will need roughly £1040, and single households are likely to need an additional £560.
By January, single households are more likely than other households to have to choose between not heating, eating or meeting bills to manage the cost of living crisis. Almost 1 in 5 single households will not be able to afford all of their essential costs without additional support, up from 1 in 10 in July 2022.
Uprating Universal Credit and legacy benefits is an effective way to meet the variations in household needs
Supporting low income households during the cost of living crisis ought to take into account the household variations in the impact of the energy price cap rise and inflation.
Leveraging Universal Credit to reach low income households is an effective way to assess household needs and provide monthly support. Universal Credit has already proven its ability to deliver support to vulnerable households during the pandemic. It would be a missed opportunity to ignore this policy lever now.
In our previous blog we demonstrated that uprating benefits by 13.3% in October and by 8.5% in January would neutralise the rises in energy costs and loss of income for the average low income family.
This could mean that a couple with children could gain £423 between October and January, and £729 from January to April. Single households would receive an additional £133 from October to January, and an extra £230 from January to April. Uprating work allowances would also help to ensure that single working households are able to meet their essential costs without falling into negative budgets.
The benefit cap would also need to be uprated in line with median earnings for benefit capped households to see this increase in their benefits. This would ensure these households could afford their essential costs, and rents in most places in the UK.
Administrative data can target support to households most in need
Local authorities might consider exploring options to target support to households using their administrative data. Benefits might be adjusted based on household type.
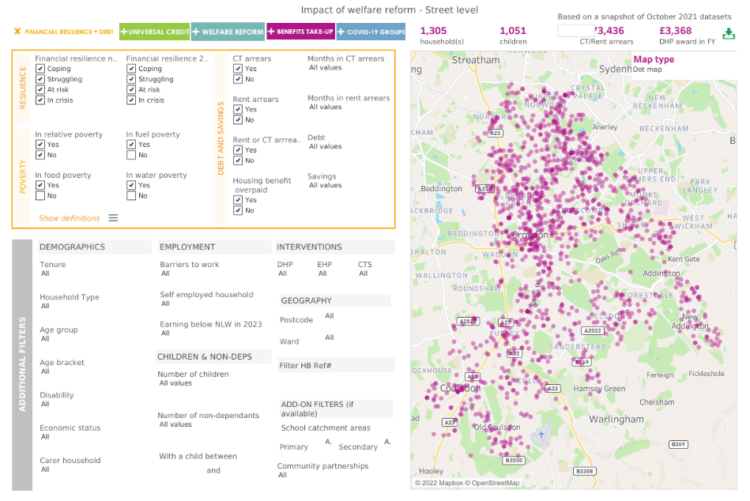
The image above from the Low Income Family Tracker (LIFT) platform shows how it can identify hundreds of households in food, fuel and water poverty. Using insights from the platform local authorities might award specific household types with additional discretionary support to meet rents or energy costs.
Read how we created these forecasts.
Entitlement calculators give people access to support
This sobering analysis does not mean that you are going to be left in the dark. Over £15 billion of existing benefits and support is unclaimed by households every year. People are not always aware of the support available to them. We strongly encourage people to use a free benefits calculator such as the Better Off Calculator to ensure they’re claiming all the support they’re eligible for.
Further reading: our analysis and response to the cost of living crisis
New analysis: Increasing Universal Credit by 13.3% will help low-income households pay for increased energy costs
Our new analysis shows that increasing Universal Credit will neutralise rising energy bills and household costs for low income households.
New analysis: Three costed policies to help low-income households with the cost of living crisis
Our three costed policies to help households through the cost of living crisis require investment of £6.8billion to prevent severe hardship.
Cost of living: How the energy price cap affects different households
We look at how the energy price cap affects different households and find that energy bills could jump to £11,000 for larger families
On Target: Protecting vulnerable households from the inflation crisis
The Centre for Social Justice is calling for a 13.3% increase to Universal Credit, to rise by a further 8.5% in January, based on new analysis by Policy in Practice.
Subscribe to our blog to automatically receive all our policy blog posts by email.


