Brexit: What’s next for ESF and local authorities?

On 23 June 2016 the United Kingdom voted to leave the European Union by 51.8% to 48.2%.
One of the many potential impacts that a UK exit from the EU could have is increased pressure on local authorities if, or when, European Social Funds (ESF) to the UK are terminated.
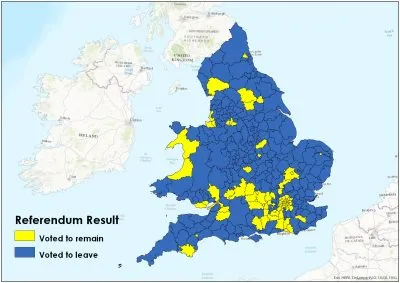
The Referendum Result map opposite shows how different areas of England and Wales voted.
In this blog post we analyse which local authorities are most at risk from ESF cuts and who, in order to maintain current levels of investment into employment, will have to identify alternative sources of funding.
We also look at a programme funded by ESF and give a clear view of the type of replacement investment that would be required.
How much does the UK contribute to the EU? And what does it get back?
One of the hotly debated topics of the referendum campaign was the net economic contribution made by the UK to the EU.
The EU budget, which is calculated in 7 year tranches, is made up of contributions from all 28 member states.
For the last funding period (2007-2013), the UK contributed €77.7 billion to the EU buget, a figure that includes a rebate negotiated by Margaret Thatcher, while €47.5 billion was invested back in a range of measures.
In the UK, these re-investments largely take the form of European Structural and Investment Funds (ESIF), the Horizon 2020 research fund plus a range of more specific programmes such as Erasmus+.
Here, we focus on ESIF, which is made up of the following 5 components:
- European Regional Development Fund (ERDF)
- European Social Funds (ESF)
- Cohesion Funds
- European Agricultural Fund for Rural Development (EAFRD)
- European Maritime and Fisheries Fund (EMFF)
Specifically, we look at European Social Funds, which were set up under the Treaty of Rome to improve workers’ mobility and employment opportunities in the common market. Today, the ESF objectives can be broadly defined as to:
- improve employment opportunities in the European Union and help raise standards of living
- help people to get better skills and better job prospects
- help equip the workforce with the skills needed by business in a competitive global economy
For 2007-2013, the UK received €4.47 billion of ESF funding which, when matched by national co-funding, brings the total spend on ESF projects to €8.6 billion. €3.5bn in ESF funding, which would likely all be matched by national contributions, has been allocated to the UK for 2014 – 2020 tranche.
How are ESF funds currently distributed within the UK?
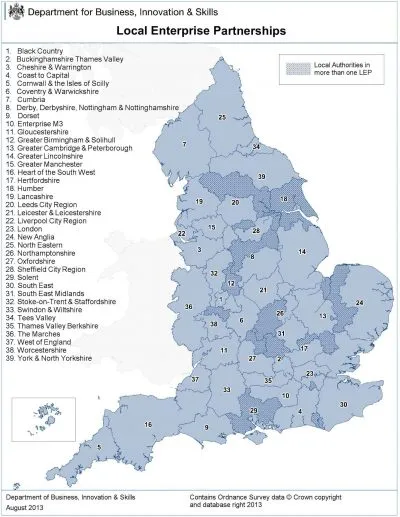
Within the UK, ESF funds are allocated to Local Enterprise Partnerships (LEPs), geographical sub-divisions which often group together and /or split traditional local authorities, as shown in the map below.
Successful applications to access the latest tranches of funds came from all 39 existing LEPs across England & Wales. However, following the vote to leave, a significant level of doubt has now been cast on the future availability of this investment.
Based on ESF legislation, the force majeure in the UK exiting the EU would allow ESF to be ‘decommitted’. In other words, for the purposes of this analysis, Policy in Practice assumes that ESF could be cut off mid-tranche and not be maintained through to 2020.
Of course, the ultimate impact of reduced ESF funding depends upon the priorities of the government, the extent to which it focuses investment on social programmes, and the impact of Brexit on the economy overall.
Political negotiations not-with-standing, for policy makers in Britain business will certainly not be as usual. Support to low income areas / households previously channelled via ESF is now at risk of being terminated, and alternative ways of funding may have to be secured by the local authorities most heavily impacted.
To compound the funding risks further, several local authorities in England and Wales are also in receipt of European Regional Development funds – money allocated to the poorest regions in the EU as an effort to achieve a European ‘convergence’.
Whilst ERD funds are focused more on industry, their termination could also ultimately add extra pressure on already beleaguered local authorities. For analysis of wider ESIF funding see JRF’s recent analysis.
Which local authorities in England and Wales are most at risk if ESF is terminated?
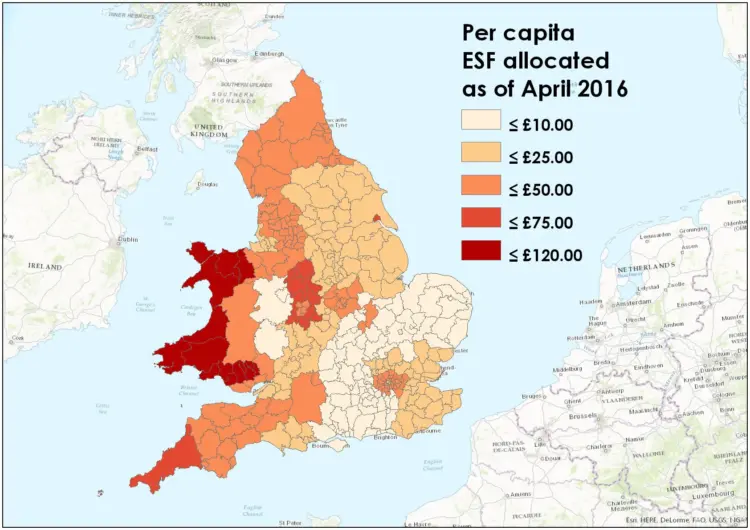
As shown in the map below, the geographical impact is very varied, with a notable distinction between the West of England/Wales and the East of England.
It is important to note two things. Firstly, ESF does not constitute direct transfers (as is the case with Agriculture subsidies which are paid straight to farmers), so the potential monetary loss per capita only serves as an indication of how people in each local authority will be affected. ESF invests in projects which in turn help people into work, training, skills etc. The value of this is particularly hard to capture.
Secondly, the figures above correspond to the per capita loss of 2014 – 2020 ESF that had been allocated as of April 2016. Given that just over 21% of the total ESF for 2014 – 2020 has been earmarked, the per capita loss in ESF for the whole period is likely to be a lot higher.
The chart below shows the per capita ESF allocated as of April 2016 from the 2014 – 2020 tranche.
The main trends are as follows:
-
Many councils in Wales and West Midlands severely affected
This trend is particularly pronounced in Wales, where the local authorities making up the West Wales and The Valleys LEP are at risk of losing an average of £101.53 per person. Several local authorities in the West Midlands, Cornwall and Hull will also lose at least £50 per person in ESF.
-
Local authorities / Boroughs in much of South West, London and the North moderately affected
Several boroughs in North East greater London would risk losing at least £50 per person, while many LAs in Cornwall, Devon and Somerset would also be significantly affected.
-
Few local authorities affected in South East / East of England
Local authorities in the South East are significantly less affected than their Northern counterparts. With the exception of the London Boroughs, all local authorities in the South East will lose less than £25 per person, a figure which is arguably more manageable.
One stark conclusion from our analysis is that the potential loss in ESF funding equates to more per annum than has currently been allocated for the Work and Health programme, the planned successor to the Work Programme, administered by DWP.
What types of projects are at stake from ESF cuts?
Case study: Building Better Opportunities Project, North East England LEP
The North East LEP covers County Durham, Gateshead, Newcastle upon Tyne, North Tyneside, Northumberland, South Tyneside and Sunderland.
This project aims to tackle the root causes of poverty, promote social inclusion and to drive local jobs and economic growth. It has a total budget of £18,500,000, of which £9,500,000 comes from the ESF and £9,000,000 from the Big Lottery Fund.
In the North East, health issues have been identified as a significant barrier to work for many people. The Building Better Opportunities Project funds schemes that tackle this, such as one called ‘Fitness First’. This scheme runs a 12-week physical activity and well-being programme for homeless people in partnership with Northumbria University. The aim is to improve participants’ physical and mental health so that they are in better shape to find employment. They received £9,400.
Another example of a funded scheme is ‘Reaching the Streets’ in Newcastle Upon Tyne, which helps people, mainly aged between 16 and 35, who are affected by homelessness, alcohol and substance abuse, and mental and physical health issues. The scheme offers support on a one to one basis, and improves lives with psychotherapeutic interventions, peer support, recovery support, volunteering and mentoring. As this scheme takes place at such a personal level, the chances of success for people taking part is much greater. Tailored help can be given to each individual.
So, what now?
Ultimately, the referendum result has cast into doubt the European funding that LEPs (and in turn, local authorities) currently receive to improve employment opportunities, equip the workforce with skills needed by businesses and tackle the root causes of poverty.
Policy in Practice advocates that a future government should prioritise properly funded, effective interventions, like the Fitness First scheme mentioned above. This will lend continuity to efforts that tackle the root causes of poverty, and show that the government is ready to support people that are hardest hit, and most in need.
Use the search box in the table below to see how your local authority is likely to be impacted, by the total amount of ESF funding potentially at risk from the 2014 – 2020 tranche.
Local Authority | LEP | Population | Total Loss | Loss per Capita | total_esf_la2 | pct_remain | pct_leave | Spend per capita | LA | Population | |||||
---|---|---|---|---|---|---|---|---|---|---|---|---|---|---|---|
Adur | Coast to Capital | 63,176 | £276,599 | £4.38 | £587,474 | 45.4 | 54.6 | £9.30 | County Durham | 517773 | |||||
Allerdale | Cumbria | 96,471 | £3,950,671 | £40.95 | £3,398,148 | 41.3 | 58.7 | £35.22 | Darlington | 105367 | |||||
Amber Valley | D2N2 | 123,942 | £1,992,484 | £16.08 | £1,590,294 | 39.7 | 60.3 | £12.83 | Hartlepool | 92590 | |||||
Arun | Coast to Capital | 154,414 | £676,059 | £4.38 | £587,474 | 37.5 | 62.5 | £3.80 | Middlesbrough | 139119 | |||||
Ashfield | D2N2 | 122,508 | £1,969,431 | £16.08 | £1,590,294 | 30.2 | 69.8 | £12.98 | Northumberland | 315987 | |||||
Ashford | South East | 123,285 | £1,460,991 | £11.85 | £1,485,888 | 40.6 | 59.4 | £12.05 | Redcar and Cleveland | 135042 | |||||
Aylesbury Vale | SEMLEP | 184,560 | £1,150,088 | £6.23 | £1,305,051 | 49.5 | 50.5 | £7.07 | Stockton-on-Tees | 194119 | |||||
Babergh | New Anglia | 88,845 | £762,542 | £8.58 | £791,651 | 45.8 | 54.2 | £8.91 | Gateshead | 200505 | |||||
Barking and Dagenham | North East London | 198,294 | £6,880,802 | £34.70 | £18,100,000 | 37.6 | 62.4 | £91.28 | Newcastle upon Tyne | 289835 | |||||
Barnet | North West London | 374,915 | £13,009,551 | £34.70 | £5,000,000 | 62.2 | 37.8 | £13.34 | North Tyneside | 202744 | |||||
Barnsley | Leeds City Region | 237,843 | £2,740,702 | £11.52 | £5,431,763 | 31.7 | 68.3 | £22.84 | South Tyneside | 148740 | |||||
Barrow-in-Furness | Cumbria | 67,648 | £2,770,314 | £40.95 | £3,398,148 | 39.4 | 60.6 | £50.23 | Sunderland | 276889 | |||||
Basildon | South East | 180,521 | £2,139,267 | £11.85 | £1,485,888 | 31.4 | 68.6 | £8.23 | Blackburn with Darwen | 146743 | |||||
Basingstoke and Deane | Enterprise M3 | 172,870 | £875,610 | £5.07 | £408,730 | 48.1 | 51.9 | £2.36 | Blackpool | 140501 | |||||
Bassetlaw | Sheffield City Region | 114,143 | £1,268,874 | £11.12 | £3,559,430 | 32.2 | 67.8 | £31.18 | Cheshire East | 374179 | |||||
Bath and North East Somerset | West of England | 182,021 | £2,017,080 | £11.08 | £3,059,083 | 57.8 | 42.2 | £16.81 | Cheshire West and Chester | 332210 | |||||
Bedford | SEMLEP | 163,924 | £1,021,495 | £6.23 | £927,273 | 48.2 | 51.8 | £5.66 | Halton | 126354 | |||||
Bexley | South London | 239,865 | £8,323,316 | £34.70 | £6,285,714 | 37.0 | 63.0 | £26.21 | Warrington | 206428 | |||||
Birmingham | Greater Birmingham and Solihull | 1,101,360 | £61,187,191 | £55.56 | £14,000,000 | 49.6 | 50.4 | £12.71 | Allerdale | 96471 | |||||
Blaby | Leicester and Leicestershire | 95,851 | £2,827,814 | £29.50 | £3,708,270 | 40.5 | 59.5 | £38.69 | Barrow-in-Furness | 67648 | |||||
Blackburn with Darwen | Lancashire | 146,743 | £5,145,161 | £35.06 | £3,686,508 | 43.7 | 56.3 | £25.12 | Carlisle | 108022 | |||||
Blackpool | Lancashire | 140,501 | £4,926,302 | £35.06 | £3,686,508 | 32.5 | 67.5 | £26.24 | Copeland | 69832 | |||||
Blaenau Gwent | West Wales and the Valleys | 69,674 | £7,073,832 | £101.53 | £28,746,666 | 38.0 | 62.0 | £412.59 | Eden | 52630 | |||||
Bolsover | Sheffield City Region | 77,155 | £857,696 | £11.12 | £3,559,430 | 29.2 | 70.8 | £46.13 | South Lakeland | 103271 | |||||
Bolton | Greater Manchester | 280,439 | £11,059,900 | £39.44 | £10,777,778 | 41.7 | 58.3 | £38.43 | Bolton | 280439 | |||||
Boston | Greater Lincolnshire | 66,458 | £965,752 | £14.53 | £1,712,435 | 24.4 | 75.6 | £25.77 | Bury | 187474 | |||||
Bournemouth | Dorset | 191,390 | £4,161,355 | £21.74 | £1,967,161 | 45.1 | 54.9 | £10.28 | Manchester | 520215 | |||||
Bracknell Forest | Thames Valley and Berkshire | 118,025 | £686,734 | £5.82 | £858,870 | 46.1 | 53.9 | £7.28 | Oldham | 228765 | |||||
Bradford | Leeds City Region | 528,155 | £6,086,013 | £11.52 | £3,462,627 | 45.8 | 54.2 | £6.56 | Rochdale | 212962 | |||||
Braintree | South East | 149,985 | £1,777,399 | £11.85 | £1,485,888 | 38.9 | 61.1 | £9.91 | Salford | 242040 | |||||
Breckland | New Anglia | 133,986 | £1,149,980 | £8.58 | £791,651 | 35.8 | 64.2 | £5.91 | Stockport | 286755 | |||||
Brent | North West London | 320,762 | £11,130,441 | £34.70 | £5,000,000 | 59.7 | 40.3 | £15.59 | Tameside | 220771 | |||||
Brentwood | South East | 75,645 | £896,432 | £11.85 | £1,485,888 | 40.8 | 59.2 | £19.64 | Trafford | 232458 | |||||
Bridgend | West Wales and the Valleys | 141,214 | £14,337,115 | £101.53 | £14,746,667 | 45.4 | 54.6 | £104.43 | Wigan | 320975 | |||||
Brighton and Hove | Coast to Capital | 281,076 | £1,230,613 | £4.38 | £587,474 | 68.6 | 31.4 | £2.09 | Burnley | 87291 | |||||
Bristol, City of | West of England | 442,474 | £4,903,309 | £11.08 | £3,059,083 | 61.7 | 38.3 | £6.91 | Chorley | 111607 | |||||
Broadland | New Anglia | 125,961 | £1,081,103 | £8.58 | £791,651 | 45.6 | 54.4 | £6.28 | Fylde | 77042 | |||||
Bromley | South London | 321,278 | £11,148,347 | £34.70 | £6,285,714 | 50.7 | 49.3 | £19.56 | Hyndburn | 80208 | |||||
Bromsgrove | Greater Birmingham and Solihull | 95,485 | £5,304,768 | £55.56 | £1,126,277 | 44.6 | 55.4 | £11.80 | Lancaster | 141277 | |||||
Broxbourne | Hertfordshire | 95,748 | £1,258,335 | £13.14 | £1,345,389 | 33.7 | 66.3 | £14.05 | Pendle | 89840 | |||||
Broxtowe | D2N2 | 111,780 | £1,796,968 | £16.08 | £1,590,294 | 45.3 | 54.7 | £14.23 | Preston | 140452 | |||||
Burnley | Lancashire | 87,291 | £3,060,632 | £35.06 | £3,686,508 | 33.4 | 66.6 | £42.23 | Ribble Valley | 58091 | |||||
Bury | Greater Manchester | 187,474 | £7,393,564 | £39.44 | £10,777,778 | 45.9 | 54.1 | £57.49 | Rossendale | 69168 | |||||
Caerphilly | West Wales and the Valleys | 179,941 | £18,268,974 | £101.53 | £14,746,667 | 42.4 | 57.6 | £81.95 | South Ribble | 109077 | |||||
Calderdale | Leeds City Region | 207,376 | £2,389,626 | £11.52 | £3,462,627 | 44.3 | 55.7 | £16.70 | West Lancashire | 111940 | |||||
Cambridge | Greater Cambridge/Peterborough | 128,515 | £1,260,838 | £9.81 | £1,151,382 | 73.8 | 26.2 | £8.96 | Wyre | 108742 | |||||
Camden | Central London | 234,846 | £8,149,156 | £34.70 | £38,220,000 | 74.9 | 25.1 | £162.74 | Knowsley | 146407 | |||||
Cannock Chase | Greater Birmingham and Solihull | 98,549 | £5,474,991 | £55.56 | £3,991,706 | 31.1 | 68.9 | £40.50 | Liverpool | 473073 | |||||
Canterbury | South East | 157,649 | £1,868,222 | £11.85 | £1,485,888 | 49.0 | 51.0 | £9.43 | Sefton | 273531 | |||||
Cardiff | East Wales | 354,294 | £14,860,949 | £41.95 | £6,857,143 | 60.0 | 40.0 | £19.35 | St. Helens | 177188 | |||||
Carlisle | Cumbria | 108,022 | £4,423,707 | £40.95 | £3,398,148 | 39.9 | 60.1 | £31.46 | Wirral | 320914 | |||||
Carmarthenshire | West Wales and the Valleys | 184,898 | £18,772,246 | £101.53 | £15,146,667 | 46.3 | 53.8 | £81.92 | East Riding of Yorkshire | 337115 | |||||
Castle Point | South East | 88,011 | £1,042,976 | £11.85 | £1,485,888 | 27.3 | 72.7 | £16.88 | Kingston upon Hull, City of | 257710 | |||||
Central Bedfordshire | SEMLEP | 269,076 | £1,676,751 | £6.23 | £927,273 | 43.9 | 56.1 | £3.45 | North East Lincolnshire | 159804 | |||||
Ceredigion | West Wales and the Valleys | 75,425 | £7,657,717 | £101.53 | £15,146,667 | 54.6 | 45.4 | £200.82 | North Lincolnshire | 169247 | |||||
Charnwood | Leicester and Leicestershire | 173,545 | £5,119,957 | £29.50 | £3,708,270 | 46.2 | 53.8 | £21.37 | York | 204439 | |||||
Chelmsford | South East | 171,633 | £2,033,939 | £11.85 | £1,485,888 | 47.2 | 52.8 | £8.66 | Craven | 55696 | |||||
Cheltenham | Gloucestershire | 116,495 | £2,404,965 | £20.64 | £2,103,426 | 56.2 | 43.8 | £18.06 | Hambleton | 89828 | |||||
Cherwell | Oxfordshire | 144,494 | £769,661 | £5.33 | £1,643,717 | 49.7 | 50.3 | £11.38 | Harrogate | 157267 | |||||
Cheshire East | Cheshire and Warrington | 374,179 | £11,887,586 | £31.77 | £9,666,667 | 48.8 | 51.2 | £25.83 | Richmondshire | 52729 | |||||
Cheshire West and Chester | Cheshire and Warrington | 332,210 | £10,554,240 | £31.77 | £9,666,667 | 49.3 | 50.7 | £29.10 | Ryedale | 52655 | |||||
Chesterfield | Sheffield City Region | 104,288 | £1,159,320 | £11.12 | £3,559,430 | 40.0 | 60.0 | £34.13 | Scarborough | 108006 | |||||
Chichester | Coast to Capital | 115,527 | £505,803 | £4.38 | £587,474 | 49.1 | 50.9 | £5.09 | Selby | 85355 | |||||
Chiltern | Buckinghamshire Thames Valley | 93,972 | £528,183 | £5.62 | £377,778 | 55.0 | 45.0 | £4.02 | Barnsley | 237843 | |||||
Chorley | Lancashire | 111,607 | £3,913,209 | £35.06 | £3,686,508 | 43.2 | 56.8 | £33.03 | Doncaster | 304185 | |||||
Christchurch | Dorset | 48,895 | £1,063,114 | £21.74 | £1,967,161 | 41.2 | 58.8 | £40.23 | Rotherham | 260070 | |||||
City of London | Central London | 8,072 | £280,098 | £34.70 | £38,220,000 | 75.3 | 24.7 | £4,734.89 | Sheffield | 563749 | |||||
Colchester | South East | 180,420 | £2,138,070 | £11.85 | £1,485,888 | 46.4 | 53.6 | £8.24 | Bradford | 528155 | |||||
Conwy | West Wales and the Valleys | 116,287 | £11,806,337 | £101.53 | £15,556,667 | 46.0 | 54.0 | £133.78 | Calderdale | 207376 | |||||
Copeland | Cumbria | 69,832 | £2,859,753 | £40.95 | £3,398,148 | 38.0 | 62.0 | £48.66 | Kirklees | 431020 | |||||
Corby | SEMLEP | 65,434 | £407,753 | £6.23 | £1,886,081 | 35.8 | 64.3 | £28.82 | Leeds | 766399 | |||||
Cornwall,Isles of Scilly | Cornwall | 135,266 | £8,832,978 | £65.30 | £22,015,022 | 43.5 | 56.5 | £162.75 | Wakefield | 331379 | |||||
Cotswold | Gloucestershire | 84,637 | £1,747,277 | £20.64 | £2,103,426 | 51.1 | 48.9 | £24.85 | Derby | 252463 | |||||
County Durham | North East | 517,773 | £13,435,894 | £25.95 | £7,237,927 | 42.5 | 57.5 | £13.98 | Leicester | 337653 | |||||
Coventry | Coventry and Warwickshire | 337,428 | £4,883,286 | £14.47 | £2,144,333 | 44.4 | 55.6 | £6.35 | Nottingham | 314268 | |||||
Craven | Leeds City Region | 55,696 | £641,794 | £11.52 | £4,773,022 | 47.2 | 52.8 | £85.70 | Rutland | 38022 | |||||
Crawley | Coast to Capital | 109,883 | £481,092 | £4.38 | £587,474 | 41.6 | 58.4 | £5.35 | Amber Valley | 123942 | |||||
Croydon | Coast to Capital | 376,040 | £1,646,387 | £4.38 | £587,474 | 54.3 | 45.7 | £1.56 | Bolsover | 77155 | |||||
Dacorum | Hertfordshire | 149,741 | £1,967,920 | £13.14 | £1,345,389 | 49.3 | 50.7 | £8.98 | Chesterfield | 104288 | |||||
Darlington | TEES Valley | 105,367 | £3,415,180 | £32.41 | £3,752,133 | 43.8 | 56.2 | £35.61 | Derbyshire Dales | 71281 | |||||
Dartford | South East | 102,234 | £1,211,525 | £11.85 | £1,485,888 | 35.8 | 64.2 | £14.53 | Erewash | 114048 | |||||
Daventry | SEMLEP | 79,036 | £492,514 | £6.23 | £1,886,081 | 41.4 | 58.6 | £23.86 | High Peak | 91364 | |||||
Denbighshire | West Wales and the Valleys | 94,791 | £9,623,900 | £101.53 | £27,056,666 | 46.0 | 54.0 | £285.43 | North East Derbyshire | 99352 | |||||
Derby | D2N2 | 252,463 | £4,058,579 | £16.08 | £1,590,294 | 42.8 | 57.2 | £6.30 | South Derbyshire | 98374 | |||||
Derbyshire Dales | Sheffield City Region | 71,281 | £792,397 | £11.12 | £3,559,430 | 48.4 | 51.6 | £49.94 | Blaby | 95851 | |||||
Doncaster | Sheffield City Region | 304,185 | £3,381,481 | £11.12 | £1,969,136 | 31.0 | 69.0 | £6.47 | Charnwood | 173545 | |||||
Dover | South East | 113,066 | £1,339,890 | £11.85 | £1,485,888 | 37.8 | 62.2 | £13.14 | Harborough | 88008 | |||||
Dudley | Black Country | 315,799 | £11,458,457 | £36.28 | £10,519,444 | 32.4 | 67.6 | £33.31 | Hinckley and Bosworth | 107722 | |||||
Ealing | North West London | 342,118 | £11,871,495 | £34.70 | £5,000,000 | 60.4 | 39.6 | £14.61 | Melton | 50969 | |||||
East Cambridgeshire | Greater Cambridge/Peterborough | 86,685 | £850,452 | £9.81 | £1,151,382 | 49.1 | 50.9 | £13.28 | North West Leicestershire | 95882 | |||||
East Devon | Heart of South West | 136,374 | £3,535,160 | £25.92 | £2,940,383 | 45.9 | 54.1 | £21.56 | Oadby and Wigston | 55928 | |||||
East Dorset | Dorset | 88,186 | £1,917,411 | £21.74 | £1,967,161 | 42.4 | 57.6 | £22.31 | Boston | 66458 | |||||
East Hampshire | Solent | 117,483 | £442,128 | £3.76 | £948,641 | 50.5 | 49.5 | £8.07 | East Lindsey | 137623 | |||||
East Hertfordshire | Hertfordshire | 143,021 | £1,879,604 | £13.14 | £1,345,389 | 49.6 | 50.4 | £9.41 | Lincoln | 96202 | |||||
East Lindsey | Greater Lincolnshire | 137,623 | £1,999,905 | £14.53 | £1,712,435 | 29.4 | 70.7 | £12.44 | North Kesteven | 111046 | |||||
East Northamptonshire | Northamptonshire | 88,872 | £3,608,068 | £40.60 | £958,809 | 41.2 | 58.8 | £10.79 | South Holland | 90419 | |||||
East Riding of Yorkshire | York, North Yorkshire & East Riding | 337,115 | £6,208,932 | £18.42 | £4,588,173 | 39.6 | 60.4 | £13.61 | South Kesteven | 137981 | |||||
East Staffordshire | Greater Birmingham and Solihull | 115,663 | £6,425,777 | £55.56 | £3,991,706 | 36.8 | 63.2 | £34.51 | West Lindsey | 91787 | |||||
Eastbourne | South East | 101,547 | £1,203,384 | £11.85 | £1,485,888 | 42.7 | 57.3 | £14.63 | Corby | 65434 | |||||
Eastleigh | Solent | 128,877 | £485,008 | £3.76 | £539,911 | 47.5 | 52.5 | £4.19 | Daventry | 79036 | |||||
Eden | Cumbria | 52,630 | £2,155,299 | £40.95 | £3,398,148 | 46.7 | 53.3 | £64.57 | East Northamptonshire | 88872 | |||||
Elmbridge | Enterprise M3 | 132,769 | £672,493 | £5.07 | £408,730 | 59.5 | 40.5 | £3.08 | Kettering | 96945 | |||||
Enfield | North East London | 324,574 | £11,262,718 | £34.70 | £18,100,000 | 55.8 | 44.2 | £55.77 | Northampton | 219495 | |||||
Epping Forest | South East | 128,777 | £1,526,074 | £11.85 | £1,485,888 | 37.3 | 62.7 | £11.54 | South Northamptonshire | 88164 | |||||
Epsom and Ewell | Coast to Capital | 78,318 | £342,894 | £4.38 | £587,474 | 52.1 | 47.9 | £7.50 | Wellingborough | 76446 | |||||
Erewash | D2N2 | 114,048 | £1,833,428 | £16.08 | £1,590,294 | 38.8 | 61.2 | £13.94 | Ashfield | 122508 | |||||
Exeter | Heart of South West | 124,328 | £3,222,897 | £25.92 | £2,940,383 | 55.3 | 44.7 | £23.65 | Bassetlaw | 114143 | |||||
Fareham | Solent | 114,331 | £430,266 | £3.76 | £539,911 | 44.9 | 55.1 | £4.72 | Broxtowe | 111780 | |||||
Fenland | Greater Cambridge/Peterborough | 97,732 | £958,832 | £9.81 | £1,151,382 | 28.6 | 71.4 | £11.78 | Gedling | 115638 | |||||
Flintshire | East Wales | 153,804 | £6,451,347 | £41.95 | £8,767,143 | 43.6 | 56.4 | £57.00 | Mansfield | 105893 | |||||
Forest Heath | Greater Cambridge/Peterborough | 62,812 | £616,238 | £9.81 | £1,943,033 | 35.0 | 65.0 | £30.93 | Newark and Sherwood | 117758 | |||||
Forest of Dean | Gloucestershire | 83,674 | £1,727,396 | £20.64 | £2,103,426 | 41.4 | 58.6 | £25.14 | Rushcliffe | 113670 | |||||
Fylde | Lancashire | 77,042 | £2,701,277 | £35.06 | £3,686,508 | 43.0 | 57.0 | £47.85 | Herefordshire, County of | 187160 | |||||
Gateshead | North East | 200,505 | £5,202,983 | £25.95 | £7,237,927 | 43.2 | 56.8 | £36.10 | Shropshire | 310121 | |||||
Gedling | D2N2 | 115,638 | £1,858,989 | £16.08 | £1,590,294 | 44.5 | 55.5 | £13.75 | Stoke-on-Trent | 251027 | |||||
Gloucester | Gloucestershire | 125,649 | £2,593,943 | £20.64 | £2,103,426 | 41.5 | 58.5 | £16.74 | Telford and Wrekin | 169440 | |||||
Gosport | Solent | 84,287 | £317,201 | £3.76 | £539,911 | 36.1 | 63.9 | £6.41 | Cannock Chase | 98549 | |||||
Gravesham | South East | 105,261 | £1,247,397 | £11.85 | £1,485,888 | 34.6 | 65.4 | £14.12 | East Staffordshire | 115663 | |||||
Great Yarmouth | New Anglia | 98,172 | £842,594 | £8.58 | £791,651 | 28.5 | 71.5 | £8.06 | Lichfield | 102093 | |||||
Greenwich | North East London | 268,678 | £9,323,127 | £34.70 | £18,100,000 | 55.6 | 44.4 | £67.37 | Newcastle-under-Lyme | 126052 | |||||
Guildford | Enterprise M3 | 142,958 | £724,102 | £5.07 | £408,730 | 56.2 | 43.8 | £2.86 | South Staffordshire | 110692 | |||||
Gwynedd | West Wales and the Valleys | 122,273 | £12,414,081 | £101.53 | £15,556,667 | 58.0 | 42.0 | £127.23 | Stafford | 132241 | |||||
Hackney | North East London | 263,150 | £9,131,305 | £34.70 | £18,100,000 | 78.5 | 21.5 | £68.78 | Staffordshire Moorlands | 97763 | |||||
Halton | Liverpool City Region | 126,354 | £1,862,654 | £14.74 | £3,728,302 | 42.6 | 57.4 | £29.51 | Tamworth | 77112 | |||||
Hambleton | York, North Yorkshire & East Riding | 89,828 | £1,654,438 | £18.42 | £1,310,395 | 46.3 | 53.7 | £14.59 | North Warwickshire | 62468 | |||||
Hammersmith and Fulham | North West London | 178,365 | £6,189,266 | £34.70 | £5,000,000 | 70.0 | 30.0 | £28.03 | Nuneaton and Bedworth | 126174 | |||||
Harborough | Leicester and Leicestershire | 88,008 | £2,596,429 | £29.50 | £3,708,270 | 49.3 | 50.8 | £42.14 | Rugby | 102500 | |||||
Haringey | North East London | 267,541 | £9,283,673 | £34.70 | £18,100,000 | 75.6 | 24.4 | £67.65 | Stratford-on-Avon | 121056 | |||||
Harlow | South East | 84,564 | £1,002,127 | £11.85 | £1,485,888 | 31.9 | 68.1 | £17.57 | Warwick | 139396 | |||||
Harrogate | Leeds City Region | 157,267 | £1,812,212 | £11.52 | £4,773,022 | 51.0 | 49.0 | £30.35 | Birmingham | 1101360 | |||||
Harrow | North West London | 246,011 | £8,536,582 | £34.70 | £5,000,000 | 54.6 | 45.4 | £20.32 | Coventry | 337428 | |||||
Hart | Enterprise M3 | 93,325 | £472,704 | £5.07 | £408,730 | 52.4 | 47.6 | £4.38 | Dudley | 315799 | |||||
Hartlepool | TEES Valley | 92,590 | £3,001,049 | £32.41 | £3,752,133 | 30.4 | 69.6 | £40.52 | Sandwell | 316719 | |||||
Hastings | South East | 91,093 | £1,079,499 | £11.85 | £1,485,888 | 45.1 | 54.9 | £16.31 | Solihull | 209890 | |||||
Havant | Solent | 122,210 | £459,918 | £3.76 | £539,911 | 37.6 | 62.4 | £4.42 | Walsall | 274173 | |||||
Havering | North East London | 245,974 | £8,535,298 | £34.70 | £18,100,000 | 30.3 | 69.7 | £73.59 | Wolverhampton | 252987 | |||||
Herefordshire, County of | The Marches | 187,160 | £1,759,597 | £9.40 | £2,089,407 | 40.8 | 59.2 | £11.16 | Bromsgrove | 95485 | |||||
Hertsmere | Hertfordshire | 102,427 | £1,346,112 | £13.14 | £1,345,389 | 49.2 | 50.8 | £13.14 | Malvern Hills | 75911 | |||||
High Peak | D2N2 | 91,364 | £1,468,762 | £16.08 | £1,590,294 | 49.5 | 50.5 | £17.41 | Redditch | 84471 | |||||
Hillingdon | North West London | 292,690 | £10,156,343 | £34.70 | £5,000,000 | 43.6 | 56.4 | £17.08 | Worcester | 100842 | |||||
Hinckley and Bosworth | Leicester and Leicestershire | 107,722 | £3,178,035 | £29.50 | £3,708,270 | 39.7 | 60.3 | £34.42 | Wychavon | 119752 | |||||
Horsham | Coast to Capital | 134,158 | £587,374 | £4.38 | £587,474 | 51.5 | 48.5 | £4.38 | Wyre Forest | 98960 | |||||
Hounslow | North West London | 265,568 | £9,215,210 | £34.70 | £5,000,000 | 51.1 | 48.9 | £18.83 | Bedford | 163924 | |||||
Huntingdonshire | Greater Cambridge/Peterborough | 173,605 | £1,703,209 | £9.81 | £1,151,382 | 45.8 | 54.2 | £6.63 | Central Bedfordshire | 269076 | |||||
Hyndburn | Lancashire | 80,208 | £2,812,285 | £35.06 | £3,686,508 | 33.8 | 66.2 | £45.96 | Luton | 210962 | |||||
Ipswich | New Anglia | 134,966 | £1,158,391 | £8.58 | £791,651 | 41.7 | 58.3 | £5.87 | Peterborough | 190461 | |||||
Isle of Anglesey | West Wales and the Valleys | 70,169 | £7,124,088 | £101.53 | £15,556,667 | 49.1 | 50.9 | £221.70 | Southend-on-Sea | 177931 | |||||
Isle of Wight | Solent | 139,105 | £523,499 | £3.76 | £539,911 | 38.0 | 62.0 | £3.88 | Thurrock | 163270 | |||||
Islington | Central London | 221,030 | £7,669,741 | £34.70 | £38,220,000 | 75.2 | 24.8 | £172.92 | Cambridge | 128515 | |||||
Kensington and Chelsea | Central London | 156,190 | £5,419,793 | £34.70 | £38,220,000 | 68.7 | 31.3 | £244.70 | East Cambridgeshire | 86685 | |||||
Kettering | SEMLEP | 96,945 | £604,114 | £6.23 | £1,886,081 | 39.0 | 61.0 | £19.46 | Fenland | 97732 | |||||
King's Lynn and West Norfolk | Greater Cambridge/Peterborough | 150,026 | £1,471,879 | £9.81 | £1,943,033 | 33.6 | 66.4 | £12.95 | Huntingdonshire | 173605 | |||||
Kingston upon Hull, City of | Humber | 257,710 | £13,111,111 | £50.88 | £3,277,778 | 32.4 | 67.6 | £12.72 | South Cambridgeshire | 153281 | |||||
Kingston upon Thames | South London | 169,958 | £5,897,543 | £34.70 | £6,285,714 | 61.6 | 38.4 | £36.98 | Basildon | 180521 | |||||
Kirklees | Leeds City Region | 431,020 | £4,966,711 | £11.52 | £3,462,627 | 45.3 | 54.7 | £8.03 | Braintree | 149985 | |||||
Knowsley | Liverpool City Region | 146,407 | £2,158,266 | £14.74 | £3,728,302 | 48.4 | 51.6 | £25.47 | Brentwood | 75645 | |||||
Lambeth | Central London | 318,216 | £11,042,095 | £34.70 | £38,220,000 | 78.6 | 21.4 | £120.11 | Chelmsford | 171633 | |||||
Lancaster | Lancashire | 141,277 | £4,953,510 | £35.06 | £3,686,508 | 48.9 | 51.1 | £26.09 | Colchester | 180420 | |||||
Leeds | Leeds City Region | 766,399 | £8,831,337 | £11.52 | £3,462,627 | 50.3 | 49.7 | £4.52 | Epping Forest | 128777 | |||||
Leicester | Leicester and Leicestershire | 337,653 | £9,961,502 | £29.50 | £3,708,270 | 51.1 | 48.9 | £10.98 | Harlow | 84564 | |||||
Lewes | South East | 100,229 | £1,187,765 | £11.85 | £2,073,363 | 52.1 | 47.9 | £20.69 | Maldon | 62767 | |||||
Lewisham | Central London | 291,933 | £10,130,075 | £34.70 | £38,220,000 | 69.9 | 30.1 | £130.92 | Rochford | 84776 | |||||
Lichfield | Greater Birmingham and Solihull | 102,093 | £5,671,882 | £55.56 | £3,991,706 | 41.2 | 58.8 | £39.10 | Tendring | 139916 | |||||
Lincoln | Greater Lincolnshire | 96,202 | £1,397,985 | £14.53 | £1,712,435 | 43.1 | 56.9 | £17.80 | Uttlesford | 84042 | |||||
Liverpool | Liverpool City Region | 473,073 | £6,973,829 | £14.74 | £3,728,302 | 58.2 | 41.8 | £7.88 | Broxbourne | 95748 | |||||
Luton | SEMLEP | 210,962 | £1,314,613 | £6.23 | £927,273 | 43.5 | 56.5 | £4.40 | Dacorum | 149741 | |||||
Maidstone | South East | 161,819 | £1,917,638 | £11.85 | £1,485,888 | 41.3 | 58.8 | £9.18 | East Hertfordshire | 143021 | |||||
Maldon | South East | 62,767 | £743,821 | £11.85 | £1,485,888 | 37.4 | 62.6 | £23.67 | Hertsmere | 102427 | |||||
Malvern Hills | Worcestershire | 75,911 | £1,730,092 | £22.79 | £1,126,277 | 47.8 | 52.2 | £14.84 | North Hertfordshire | 131046 | |||||
Manchester | Greater Manchester | 520,215 | £20,516,140 | £39.44 | £10,777,778 | 60.4 | 39.6 | £20.72 | St Albans | 144834 | |||||
Mansfield | D2N2 | 105,893 | £1,702,329 | £16.08 | £1,590,294 | 29.1 | 70.9 | £15.02 | Stevenage | 85997 | |||||
Medway | South East | 274,015 | £3,247,219 | £11.85 | £1,485,888 | 35.9 | 64.1 | £5.42 | Three Rivers | 90423 | |||||
Melton | Leicester and Leicestershire | 50,969 | £1,503,697 | £29.50 | £3,708,270 | 41.9 | 58.1 | £72.76 | Watford | 95505 | |||||
Mendip | Heart of South West | 110,844 | £2,873,357 | £25.92 | £2,940,383 | 51.1 | 48.9 | £26.53 | Welwyn Hatfield | 116024 | |||||
Merthyr Tydfil | West Wales and the Valleys | 59,065 | £5,996,726 | £101.53 | £14,746,667 | 43.6 | 56.4 | £249.67 | Breckland | 133986 | |||||
Merton | South London | 203,515 | £7,061,971 | £34.70 | £6,285,714 | 62.9 | 37.1 | £30.89 | Broadland | 125961 | |||||
Mid Devon | Heart of South West | 79,198 | £2,053,013 | £25.92 | £2,940,383 | 46.7 | 53.3 | £37.13 | Great Yarmouth | 98172 | |||||
Mid Suffolk | New Anglia | 99,121 | £850,739 | £8.58 | £791,651 | 44.8 | 55.2 | £7.99 | King's Lynn and West Norfolk | 150026 | |||||
Mid Sussex | Coast to Capital | 144,377 | £632,115 | £4.38 | £587,474 | 53.1 | 46.9 | £4.07 | North Norfolk | 102867 | |||||
Middlesbrough | TEES Valley | 139,119 | £4,509,158 | £32.41 | £3,752,133 | 34.5 | 65.5 | £26.97 | Norwich | 137472 | |||||
Milton Keynes | SEMLEP | 259,245 | £1,615,489 | £6.23 | £927,273 | 48.6 | 51.4 | £3.58 | South Norfolk | 129226 | |||||
Mole Valley | Coast to Capital | 86,234 | £377,552 | £4.38 | £587,474 | 53.1 | 46.9 | £6.81 | Babergh | 88845 | |||||
Monmouthshire | East Wales | 92,336 | £3,873,056 | £41.95 | £6,857,143 | 50.4 | 49.6 | £74.26 | Forest Heath | 62812 | |||||
Neath Port Talbot | West Wales and the Valleys | 140,490 | £14,263,609 | £101.53 | £22,646,666 | 43.2 | 56.8 | £161.20 | Ipswich | 134966 | |||||
New Forest | Solent | 178,907 | £673,288 | £3.76 | £948,641 | 42.2 | 57.8 | £5.30 | Mid Suffolk | 99121 | |||||
Newark and Sherwood | D2N2 | 117,758 | £1,893,070 | £16.08 | £1,590,294 | 39.6 | 60.4 | £13.50 | St Edmundsbury | 112073 | |||||
Newcastle upon Tyne | North East | 289,835 | £7,521,042 | £25.95 | £7,237,927 | 50.7 | 49.3 | £24.97 | Suffolk Coastal | 124776 | |||||
Newcastle-under-Lyme | Stoke and Staffordshire | 126,052 | £6,309,029 | £50.05 | £3,991,706 | 37.0 | 63.0 | £31.67 | Waveney | 115919 | |||||
Newham | North East London | 324,322 | £11,253,973 | £34.70 | £18,100,000 | 52.8 | 47.2 | £55.81 | Camden | 234846 | |||||
Newport | East Wales | 146,841 | £6,159,282 | £41.95 | £11,057,143 | 44.0 | 56.0 | £75.30 | City of London | 8072 | |||||
North Devon | Heart of South West | 94,059 | £2,438,248 | £25.92 | £2,940,383 | 43.0 | 57.0 | £31.26 | Hackney | 263150 | |||||
North Dorset | Dorset | 70,043 | £1,522,931 | £21.74 | £1,967,161 | 43.6 | 56.4 | £28.09 | Hammersmith and Fulham | 178365 | |||||
North East Derbyshire | Sheffield City Region | 99,352 | £1,104,449 | £11.12 | £3,559,430 | 37.2 | 62.8 | £35.83 | Haringey | 267541 | |||||
North East Lincolnshire | Greater Lincolnshire | 159,804 | £2,322,234 | £14.53 | £4,990,212 | 30.1 | 69.9 | £31.23 | Islington | 221030 | |||||
North Hertfordshire | Greater Cambridge/Peterborough | 131,046 | £1,285,670 | £9.81 | £2,496,771 | 54.4 | 45.6 | £19.05 | Kensington and Chelsea | 156190 | |||||
North Kesteven | Greater Lincolnshire | 111,046 | £1,613,694 | £14.53 | £1,712,435 | 37.7 | 62.3 | £15.42 | Lambeth | 318216 | |||||
North Lincolnshire | Greater Lincolnshire | 169,247 | £2,459,458 | £14.53 | £4,990,212 | 33.7 | 66.3 | £29.48 | Lewisham | 291933 | |||||
North Norfolk | New Anglia | 102,867 | £882,891 | £8.58 | £791,651 | 41.1 | 58.9 | £7.70 | Newham | 324322 | |||||
North Somerset | West of England | 208,154 | £2,306,674 | £11.08 | £3,059,083 | 47.8 | 52.2 | £14.70 | Southwark | 302538 | |||||
North Tyneside | North East | 202,744 | £5,261,083 | £25.95 | £7,237,927 | 46.6 | 53.4 | £35.70 | Tower Hamlets | 284015 | |||||
North Warwickshire | Coventry and Warwickshire | 62,468 | £904,042 | £14.47 | £2,144,333 | 33.1 | 66.9 | £34.33 | Wandsworth | 312145 | |||||
North West Leicestershire | Leicester and Leicestershire | 95,882 | £2,828,729 | £29.50 | £3,708,270 | 39.3 | 60.7 | £38.68 | Westminster | 233292 | |||||
Northampton | SEMLEP | 219,495 | £1,367,786 | £6.23 | £1,886,081 | 41.6 | 58.4 | £8.59 | Barking and Dagenham | 198294 | |||||
Northumberland | North East | 315,987 | £8,199,670 | £25.95 | £7,237,927 | 45.9 | 54.1 | £22.91 | Barnet | 374915 | |||||
Norwich | New Anglia | 137,472 | £1,179,900 | £8.58 | £791,651 | 56.2 | 43.8 | £5.76 | Bexley | 239865 | |||||
Nottingham | D2N2 | 314,268 | £5,052,153 | £16.08 | £1,590,294 | 49.2 | 50.8 | £5.06 | Brent | 320762 | |||||
Nuneaton and Bedworth | Coventry and Warwickshire | 126,174 | £1,826,001 | £14.47 | £2,144,333 | 34.0 | 66.0 | £17.00 | Bromley | 321278 | |||||
Oadby and Wigston | Leicester and Leicestershire | 55,928 | £1,649,998 | £29.50 | £3,708,270 | 45.4 | 54.6 | £66.30 | Croydon | 376040 | |||||
Oldham | Greater Manchester | 228,765 | £9,021,991 | £39.44 | £10,777,778 | 39.1 | 60.9 | £47.11 | Ealing | 342118 | |||||
Oxford | Oxfordshire | 157,997 | £841,586 | £5.33 | £716,444 | 70.3 | 29.7 | £4.53 | Enfield | 324574 | |||||
Pembrokeshire | West Wales and the Valleys | 123,666 | £12,555,509 | £101.53 | £15,146,667 | 42.9 | 57.1 | £122.48 | Greenwich | 268678 | |||||
Pendle | Lancashire | 89,840 | £3,150,006 | £35.06 | £3,686,508 | 36.8 | 63.2 | £41.03 | Harrow | 246011 | |||||
Peterborough | Greater Cambridge/Peterborough | 190,461 | £1,868,580 | £9.81 | £1,151,382 | 39.1 | 60.9 | £6.05 | Havering | 245974 | |||||
Plymouth | Heart of South West | 261,546 | £6,779,935 | £25.92 | £2,940,383 | 40.1 | 59.9 | £11.24 | Hillingdon | 292690 | |||||
Poole | Dorset | 150,109 | £3,263,790 | £21.74 | £1,967,161 | 41.8 | 58.2 | £13.10 | Hounslow | 265568 | |||||
Portsmouth | Solent | 209,085 | £786,858 | £3.76 | £539,911 | 41.9 | 58.1 | £2.58 | Kingston upon Thames | 169958 | |||||
Powys | East Wales | 132,675 | £5,565,085 | £41.95 | £6,857,143 | 46.3 | 53.7 | £51.68 | Merton | 203515 | |||||
Preston | Lancashire | 140,452 | £4,924,584 | £35.06 | £3,686,508 | 46.7 | 53.3 | £26.25 | Redbridge | 293055 | |||||
Purbeck | Dorset | 45,679 | £993,189 | £21.74 | £1,967,161 | 40.9 | 59.1 | £43.06 | Richmond upon Thames | 193585 | |||||
Reading | Thames Valley and Berkshire | 160,825 | £935,768 | £5.82 | £858,870 | 58.0 | 42.0 | £5.34 | Sutton | 198134 | |||||
Redbridge | North East London | 293,055 | £10,169,009 | £34.70 | £18,100,000 | 54.0 | 46.0 | £61.76 | Waltham Forest | 268020 | |||||
Redcar and Cleveland | TEES Valley | 135,042 | £4,377,014 | £32.41 | £3,752,133 | 33.8 | 66.2 | £27.78 | Bracknell Forest | 118025 | |||||
Redditch | Greater Birmingham and Solihull | 84,471 | £4,692,874 | £55.56 | £1,126,277 | 37.7 | 62.3 | £13.33 | Brighton and Hove | 281076 | |||||
Reigate and Banstead | Coast to Capital | 143,094 | £626,497 | £4.38 | £587,474 | 49.5 | 50.5 | £4.11 | Isle of Wight | 139105 | |||||
Rhondda Cynon Taf | West Wales and the Valleys | 236,888 | £24,050,664 | £101.53 | £13,646,667 | 46.3 | 53.7 | £57.61 | Medway | 274015 | |||||
Ribble Valley | Lancashire | 58,091 | £2,036,810 | £35.06 | £3,686,508 | 43.6 | 56.4 | £63.46 | Milton Keynes | 259245 | |||||
Richmond upon Thames | South London | 193,585 | £6,717,400 | £34.70 | £6,285,714 | 69.3 | 30.7 | £32.47 | Portsmouth | 209085 | |||||
Richmondshire | York, North Yorkshire & East Riding | 52,729 | £971,155 | £18.42 | £1,310,395 | 43.2 | 56.8 | £24.85 | Reading | 160825 | |||||
Rochdale | Greater Manchester | 212,962 | £8,398,755 | £39.44 | £10,777,778 | 39.9 | 60.1 | £50.61 | Slough | 144575 | |||||
Rochford | South East | 84,776 | £1,004,639 | £11.85 | £1,485,888 | 33.4 | 66.6 | £17.53 | Southampton | 245290 | |||||
Rossendale | Lancashire | 69,168 | £2,425,196 | £35.06 | £3,686,508 | 39.3 | 60.7 | £53.30 | West Berkshire | 155732 | |||||
Rother | South East | 92,130 | £1,091,788 | £11.85 | £1,485,888 | 41.5 | 58.5 | £16.13 | Windsor and Maidenhead | 147400 | |||||
Rotherham | Sheffield City Region | 260,070 | £2,891,075 | £11.12 | £1,969,136 | 32.1 | 67.9 | £7.57 | Wokingham | 159097 | |||||
Rugby | Coventry and Warwickshire | 102,500 | £1,483,388 | £14.47 | £2,144,333 | 43.3 | 56.7 | £20.92 | Aylesbury Vale | 184560 | |||||
Runnymede | Enterprise M3 | 84,584 | £428,430 | £5.07 | £408,730 | 45.7 | 54.3 | £4.83 | Chiltern | 93972 | |||||
Rushcliffe | D2N2 | 113,670 | £1,827,352 | £16.08 | £1,590,294 | 57.5 | 42.5 | £13.99 | South Bucks | 68512 | |||||
Rushmoor | Enterprise M3 | 95,296 | £482,687 | £5.07 | £408,730 | 41.8 | 58.2 | £4.29 | Wycombe | 174878 | |||||
Rutland | Greater Cambridge/Peterborough | 38,022 | £373,027 | £9.81 | £1,151,382 | 49.4 | 50.6 | £30.28 | Eastbourne | 101547 | |||||
Ryedale | York, North Yorkshire & East Riding | 52,655 | £969,792 | £18.42 | £1,310,395 | 44.7 | 55.3 | £24.89 | Hastings | 91093 | |||||
Salford | Greater Manchester | 242,040 | £9,545,528 | £39.44 | £10,777,778 | 43.2 | 56.8 | £44.53 | Lewes | 100229 | |||||
Sandwell | Black Country | 316,719 | £11,491,838 | £36.28 | £10,519,444 | 33.3 | 66.7 | £33.21 | Rother | 92130 | |||||
Scarborough | York, North Yorkshire & East Riding | 108,006 | £1,989,238 | £18.42 | £1,310,395 | 38.0 | 62.0 | £12.13 | Wealden | 154767 | |||||
Sedgemoor | Heart of South West | 119,057 | £3,086,259 | £25.92 | £2,940,383 | 38.8 | 61.2 | £24.70 | Basingstoke and Deane | 172870 | |||||
Sefton | Liverpool City Region | 273,531 | £4,032,271 | £14.74 | £3,728,302 | 51.9 | 48.1 | £13.63 | East Hampshire | 117483 | |||||
Selby | Leeds City Region | 85,355 | £983,559 | £11.52 | £4,773,022 | 40.8 | 59.2 | £55.92 | Eastleigh | 128877 | |||||
Sevenoaks | South East | 117,811 | £1,396,121 | £11.85 | £1,485,888 | 45.6 | 54.4 | £12.61 | Fareham | 114331 | |||||
Sheffield | Sheffield City Region | 563,749 | £6,266,931 | £11.12 | £1,969,136 | 49.0 | 51.0 | £3.49 | Gosport | 84287 | |||||
Shepway | South East | 109,452 | £1,297,062 | £11.85 | £1,485,888 | 37.8 | 62.3 | £13.58 | Hart | 93325 | |||||
Shropshire | The Marches | 310,121 | £2,915,623 | £9.40 | £2,089,407 | 43.1 | 56.9 | £6.74 | Havant | 122210 | |||||
Slough | Thames Valley and Berkshire | 144,575 | £841,217 | £5.82 | £858,870 | 45.7 | 54.3 | £5.94 | New Forest | 178907 | |||||
Solihull | Greater Birmingham and Solihull | 209,890 | £11,660,655 | £55.56 | £14,000,000 | 43.8 | 56.2 | £66.70 | Rushmoor | 95296 | |||||
South Bucks | West Wales and the Valleys | 68,512 | £6,955,857 | £101.53 | £377,778 | 49.3 | 50.7 | £5.51 | Test Valley | 119332 | |||||
South Cambridgeshire | Greater Cambridge/Peterborough | 153,281 | £1,503,813 | £9.81 | £1,151,382 | 60.2 | 39.8 | £7.51 | Winchester | 119218 | |||||
South Derbyshire | D2N2 | 98,374 | £1,581,454 | £16.08 | £1,590,294 | 39.7 | 60.3 | £16.17 | Ashford | 123285 | |||||
South Gloucestershire | West of England | 271,556 | £3,009,269 | £11.08 | £3,059,083 | 47.3 | 52.7 | £11.27 | Canterbury | 157649 | |||||
South Hams | Heart of South West | 84,108 | £2,180,292 | £25.92 | £2,940,383 | 52.8 | 47.2 | £34.96 | Dartford | 102234 | |||||
South Holland | Greater Lincolnshire | 90,419 | £1,313,948 | £14.53 | £1,712,435 | 26.4 | 73.6 | £18.94 | Dover | 113066 | |||||
South Kesteven | Greater Lincolnshire | 137,981 | £2,005,108 | £14.53 | £1,712,435 | 40.1 | 59.9 | £12.41 | Gravesham | 105261 | |||||
South Lakeland | Cumbria | 103,271 | £4,229,144 | £40.95 | £3,398,148 | 52.9 | 47.1 | £32.91 | Maidstone | 161819 | |||||
South Norfolk | New Anglia | 129,226 | £1,109,126 | £8.58 | £791,651 | 48.3 | 51.7 | £6.13 | Sevenoaks | 117811 | |||||
South Northamptonshire | SEMLEP | 88,164 | £549,395 | £6.23 | £1,886,081 | 45.7 | 54.3 | £21.39 | Shepway | 109452 | |||||
South Oxfordshire | Oxfordshire | 137,015 | £729,824 | £5.33 | £716,444 | 55.0 | 45.0 | £5.23 | Swale | 140836 | |||||
South Ribble | Lancashire | 109,077 | £3,824,501 | £35.06 | £3,686,508 | 41.4 | 58.6 | £33.80 | Thanet | 138410 | |||||
South Somerset | Heart of South West | 164,569 | £4,266,046 | £25.92 | £2,940,383 | 42.8 | 57.3 | £17.87 | Tonbridge and Malling | 124426 | |||||
South Staffordshire | Stoke and Staffordshire | 110,692 | £5,540,245 | £50.05 | £3,991,706 | 35.2 | 64.8 | £36.06 | Tunbridge Wells | 116105 | |||||
South Tyneside | North East | 148,740 | £3,859,712 | £25.95 | £7,237,927 | 38.0 | 62.0 | £48.66 | Cherwell | 144494 | |||||
Southampton | Solent | 245,290 | £923,109 | £3.76 | £539,911 | 46.2 | 53.8 | £2.20 | Oxford | 157997 | |||||
Southend-on-Sea | South East | 177,931 | £2,108,574 | £11.85 | £1,485,888 | 41.9 | 58.1 | £8.35 | South Oxfordshire | 137015 | |||||
Southwark | Central London | 302,538 | £10,498,069 | £34.70 | £38,220,000 | 72.8 | 27.2 | £126.33 | Vale of White Horse | 124852 | |||||
Spelthorne | Enterprise M3 | 98,106 | £496,920 | £5.07 | £408,730 | 39.7 | 60.3 | £4.17 | West Oxfordshire | 108158 | |||||
St Albans | Hertfordshire | 144,834 | £1,903,431 | £13.14 | £1,345,389 | 62.7 | 37.3 | £9.29 | Elmbridge | 132769 | |||||
St Edmundsbury | Greater Cambridge/Peterborough | 112,073 | £1,099,529 | £9.81 | £1,943,033 | 43.4 | 56.6 | £17.34 | Epsom and Ewell | 78318 | |||||
St. Helens | Liverpool City Region | 177,188 | £2,612,026 | £14.74 | £3,728,302 | 42.0 | 58.0 | £21.04 | Guildford | 142958 | |||||
Stafford | Stoke and Staffordshire | 132,241 | £6,618,794 | £50.05 | £3,991,706 | 44.0 | 56.0 | £30.19 | Mole Valley | 86234 | |||||
Staffordshire Moorlands | Stoke and Staffordshire | 97,763 | £4,893,136 | £50.05 | £3,991,706 | 35.3 | 64.7 | £40.83 | Reigate and Banstead | 143094 | |||||
Stevenage | Hertfordshire | 85,997 | £1,130,186 | £13.14 | £1,345,389 | 40.8 | 59.3 | £15.64 | Runnymede | 84584 | |||||
Stockport | Greater Manchester | 286,755 | £11,308,989 | £39.44 | £10,777,778 | 52.3 | 47.7 | £37.59 | Spelthorne | 98106 | |||||
Stockton-on-Tees | TEES Valley | 194,119 | £6,291,831 | £32.41 | £3,752,133 | 38.3 | 61.7 | £19.33 | Surrey Heath | 87533 | |||||
Stoke-on-Trent | Stoke and Staffordshire | 251,027 | £12,564,153 | £50.05 | £3,991,706 | 30.6 | 69.4 | £15.90 | Tandridge | 85374 | |||||
Stratford-on-Avon | Coventry and Warwickshire | 121,056 | £1,751,932 | £14.47 | £2,144,333 | 48.4 | 51.6 | £17.71 | Waverley | 122860 | |||||
Stroud | Gloucestershire | 115,093 | £2,376,021 | £20.64 | £2,103,426 | 54.6 | 45.4 | £18.28 | Woking | 99426 | |||||
Suffolk Coastal | New Anglia | 124,776 | £1,070,932 | £8.58 | £791,651 | 47.0 | 53.0 | £6.34 | Adur | 63176 | |||||
Sunderland | North East | 276,889 | £7,185,101 | £25.95 | £7,237,927 | 38.7 | 61.3 | £26.14 | Arun | 154414 | |||||
Surrey Heath | Enterprise M3 | 87,533 | £443,367 | £5.07 | £408,730 | 49.0 | 51.0 | £4.67 | Chichester | 115527 | |||||
Sutton | South London | 198,134 | £6,875,250 | £34.70 | £6,285,714 | 46.3 | 53.7 | £31.72 | Crawley | 109883 | |||||
Swale | South East | 140,836 | £1,668,979 | £11.85 | £1,485,888 | 37.5 | 62.5 | £10.55 | Horsham | 134158 | |||||
Swansea | West Wales and the Valleys | 241,297 | £24,498,299 | £101.53 | £15,146,667 | 48.5 | 51.5 | £62.77 | Mid Sussex | 144377 | |||||
Swindon | Swindon and Wiltshire | 215,799 | £5,412,262 | £25.08 | £8,764,770 | 45.3 | 54.7 | £40.62 | Worthing | 106863 | |||||
Tameside | Greater Manchester | 220,771 | £8,706,725 | £39.44 | £10,777,778 | 38.9 | 61.1 | £48.82 | Bath and North East Somerset | 182021 | |||||
Tamworth | Greater Birmingham and Solihull | 77,112 | £4,284,037 | £55.56 | £3,991,706 | 32.5 | 67.5 | £51.77 | Bournemouth | 191390 | |||||
Tandridge | Coast to Capital | 85,374 | £373,786 | £4.38 | £587,474 | 47.2 | 52.8 | £6.88 | Bristol, City of | 442474 | |||||
Taunton Deane | Heart of South West | 112,817 | £2,924,503 | £25.92 | £2,940,383 | 47.1 | 52.9 | £26.06 | Cornwall | 545335 | |||||
Teignbridge | Heart of South West | 127,360 | £3,301,494 | £25.92 | £2,940,383 | 46.1 | 53.9 | £23.09 | Isles of Scilly | 2280 | |||||
Telford and Wrekin | The Marches | 169,440 | £1,593,001 | £9.40 | £2,089,407 | 36.8 | 63.2 | £12.33 | North Somerset | 208154 | |||||
Tendring | South East | 139,916 | £1,658,077 | £11.85 | £1,485,888 | 30.5 | 69.5 | £10.62 | Plymouth | 261546 | |||||
Test Valley | Solent | 119,332 | £449,087 | £3.76 | £948,641 | 48.1 | 51.9 | £7.95 | Poole | 150109 | |||||
Tewkesbury | Gloucestershire | 85,784 | £1,770,956 | £20.64 | £2,103,426 | 46.8 | 53.3 | £24.52 | South Gloucestershire | 271556 | |||||
Thanet | South East | 138,410 | £1,640,230 | £11.85 | £1,485,888 | 36.2 | 63.8 | £10.74 | Swindon | 215799 | |||||
Three Rivers | Hertfordshire | 90,423 | £1,188,353 | £13.14 | £1,345,389 | 48.7 | 51.3 | £14.88 | Torbay | 132984 | |||||
Thurrock | South East | 163,270 | £1,934,833 | £11.85 | £1,485,888 | 27.7 | 72.3 | £9.10 | Wiltshire | 483143 | |||||
Tonbridge and Malling | South East | 124,426 | £1,474,512 | £11.85 | £1,485,888 | 44.3 | 55.7 | £11.94 | East Devon | 136374 | |||||
Torbay | Heart of South West | 132,984 | £3,447,282 | £25.92 | £2,940,383 | 36.8 | 63.2 | £22.11 | Exeter | 124328 | |||||
Torfaen | West Wales and the Valleys | 91,609 | £9,300,840 | £101.53 | £17,446,666 | 40.2 | 59.8 | £190.45 | Mid Devon | 79198 | |||||
Torridge | Heart of South West | 65,618 | £1,700,985 | £25.92 | £2,940,383 | 39.2 | 60.8 | £44.81 | North Devon | 94059 | |||||
Tower Hamlets | North East London | 284,015 | £9,855,321 | £34.70 | £18,100,000 | 67.5 | 32.5 | £63.73 | South Hams | 84108 | |||||
Trafford | Greater Manchester | 232,458 | £9,167,634 | £39.44 | £10,777,778 | 57.7 | 42.3 | £46.36 | Torridge | 65618 | |||||
Tunbridge Wells | South East | 116,105 | £1,375,904 | £11.85 | £1,485,888 | 54.9 | 45.1 | £12.80 | West Devon | 54260 | |||||
Uttlesford | Greater Cambridge/Peterborough | 84,042 | £824,522 | £9.81 | £2,637,271 | 49.3 | 50.7 | £31.38 | Christchurch | 48895 | |||||
Vale of Glamorgan | East Wales | 127,685 | £5,355,779 | £41.95 | £6,857,143 | 50.7 | 49.3 | £53.70 | East Dorset | 88186 | |||||
Vale of White Horse | Oxfordshire | 124,852 | £665,036 | £5.33 | £716,444 | 56.7 | 43.3 | £5.74 | North Dorset | 70043 | |||||
Wakefield | Leeds City Region | 331,379 | £3,818,533 | £11.52 | £3,462,627 | 33.6 | 66.4 | £10.45 | Purbeck | 45679 | |||||
Walsall | Black Country | 274,173 | £9,948,098 | £36.28 | £10,519,444 | 32.1 | 67.9 | £38.37 | West Dorset | 100474 | |||||
Waltham Forest | North East London | 268,020 | £9,300,294 | £34.70 | £18,100,000 | 59.1 | 40.9 | £67.53 | Weymouth and Portland | 64992 | |||||
Wandsworth | Central London | 312,145 | £10,831,432 | £34.70 | £38,220,000 | 75.0 | 25.0 | £122.44 | Cheltenham | 116495 | |||||
Warrington | Cheshire and Warrington | 206,428 | £6,558,173 | £31.77 | £9,666,667 | 45.7 | 54.3 | £46.83 | Cotswold | 84637 | |||||
Warwick | Coventry and Warwickshire | 139,396 | £2,017,350 | £14.47 | £2,144,333 | 58.8 | 41.2 | £15.38 | Forest of Dean | 83674 | |||||
Watford | Hertfordshire | 95,505 | £1,255,142 | £13.14 | £1,345,389 | 49.7 | 50.3 | £14.09 | Gloucester | 125649 | |||||
Waveney | New Anglia | 115,919 | £994,914 | £8.58 | £791,651 | 37.1 | 62.9 | £6.83 | Stroud | 115093 | |||||
Waverley | Enterprise M3 | 122,860 | £622,303 | £5.07 | £408,730 | 58.4 | 41.6 | £3.33 | Tewkesbury | 85784 | |||||
Wealden | South East | 154,767 | £1,834,069 | £11.85 | £1,485,888 | 45.5 | 54.5 | £9.60 | Mendip | 110844 | |||||
Wellingborough | Northamptonshire | 76,446 | £3,103,592 | £40.60 | £958,809 | 37.6 | 62.4 | £12.54 | Sedgemoor | 119057 | |||||
Welwyn Hatfield | Hertfordshire | 116,024 | £1,524,806 | £13.14 | £1,345,389 | 47.0 | 53.0 | £11.60 | South Somerset | 164569 | |||||
West Berkshire | Thames Valley and Berkshire | 155,732 | £906,134 | £5.82 | £858,870 | 51.8 | 48.2 | £5.52 | Taunton Deane | 112817 | |||||
West Devon | Heart of South West | 54,260 | £1,406,557 | £25.92 | £2,940,383 | 46.8 | 53.2 | £54.19 | West Somerset | 34322 | |||||
West Dorset | Dorset | 100,474 | £2,184,586 | £21.74 | £1,967,161 | 49.0 | 51.0 | £19.58 | Isle of Anglesey | 70169 | |||||
West Lancashire | Lancashire | 111,940 | £3,924,885 | £35.06 | £3,686,508 | 44.7 | 55.3 | £32.93 | Gwynedd | 122273 | |||||
West Lindsey | Greater Lincolnshire | 91,787 | £1,333,827 | £14.53 | £1,712,435 | 38.2 | 61.8 | £18.66 | Conwy | 116287 | |||||
West Oxfordshire | Oxfordshire | 108,158 | £576,114 | £5.33 | £716,444 | 53.7 | 46.3 | £6.62 | Denbighshire | 94791 | |||||
West Somerset | Heart of South West | 34,322 | £889,713 | £25.92 | £2,940,383 | 39.4 | 60.6 | £85.67 | Flintshire | 153804 | |||||
Westminster | Central London | 233,292 | £8,095,232 | £34.70 | £38,220,000 | 69.0 | 31.0 | £163.83 | Wrexham | 136714 | |||||
Weymouth and Portland | Dorset | 64,992 | £1,413,108 | £21.74 | £1,967,161 | 39.0 | 61.0 | £30.27 | Powys | 132675 | |||||
Wigan | Greater Manchester | 320,975 | £12,658,551 | £39.44 | £10,777,778 | 36.1 | 63.9 | £33.58 | Ceredigion | 75425 | |||||
Wiltshire | Swindon and Wiltshire | 483,143 | £12,117,278 | £25.08 | £8,764,770 | 47.5 | 52.5 | £18.14 | Pembrokeshire | 123666 | |||||
Winchester | Solent | 119,218 | £448,658 | £3.76 | £948,641 | 58.9 | 41.1 | £7.96 | Carmarthenshire | 184898 | |||||
Windsor and Maidenhead | Thames Valley and Berkshire | 147,400 | £857,654 | £5.82 | £858,870 | 53.9 | 46.1 | £5.83 | Swansea | 241297 | |||||
Wirral | Liverpool City Region | 320,914 | £4,730,769 | £14.74 | £3,728,302 | 51.7 | 48.3 | £11.62 | Neath Port Talbot | 140490 | |||||
Woking | Enterprise M3 | 99,426 | £503,606 | £5.07 | £408,730 | 56.2 | 43.8 | £4.11 | Bridgend | 141214 | |||||
Wokingham | Thames Valley and Berkshire | 159,097 | £925,713 | £5.82 | £858,870 | 56.7 | 43.3 | £5.40 | Vale of Glamorgan | 127685 | |||||
Wolverhampton | Black Country | 252,987 | £9,179,385 | £36.28 | £10,519,444 | 37.4 | 62.6 | £41.58 | Cardiff | 354294 | |||||
Worcester | Worcestershire | 100,842 | £2,298,295 | £22.79 | £1,126,277 | 46.3 | 53.7 | £11.17 | Rhondda Cynon Taf | 236888 | |||||
Worthing | Coast to Capital | 106,863 | £467,870 | £4.38 | £587,474 | 47.0 | 53.0 | £5.50 | Merthyr Tydfil | 59065 | |||||
Wrexham | East Wales | 136,714 | £5,734,502 | £41.95 | £8,767,143 | 41.0 | 59.0 | £64.13 | Caerphilly | 179941 | |||||
Wychavon | Worcestershire | 119,752 | £2,729,274 | £22.79 | £1,126,277 | 42.1 | 57.9 | £9.41 | Blaenau Gwent | 69674 | |||||
Wycombe | Buckinghamshire Thames Valley | 174,878 | £982,928 | £5.62 | £377,778 | 52.0 | 48.0 | £2.16 | Torfaen | 91609 | |||||
Wyre | Lancashire | 108,742 | £3,812,755 | £35.06 | £3,686,508 | 36.2 | 63.8 | £33.90 | Monmouthshire | 92336 | |||||
Wyre Forest | Greater Birmingham and Solihull | 98,960 | £5,497,825 | £55.56 | £1,126,277 | 36.8 | 63.2 | £11.38 | Newport | 146841 | |||||
York | Leeds City Region | 204,439 | £2,355,783 | £11.52 | £4,773,022 | 58.0 | 42.0 | £23.35 | |||||||
545335 | |||||||||||||||
2280 | |||||||||||||||
547615 | |||||||||||||||
Grand | 56,995,412 |
Find out more
We blog about policy analysis and making the welfare system simple for people to understand. Sign up to automatically receive our posts via email (see sidebar box on this page).