The Benefit Cap: the varied impact on London, Cities and Towns

Janet Harkin Published on 31st May 2016

In our National Picture of Welfare Reform series we reveal what we have learnt about the different impacts of welfare reforms. Our analysis is based on household-level data from local authorities that has been anonymised, aggregated and analysed for London Boroughs, Big Cities and Small Cities and Towns.
The first blog introduced our analysis on the National Picture of Welfare Reform and, in the second post, we focused on the varying impact of Universal Credit nationwide. In this post we look in more detail at the impact of the Benefit Cap. To learn more about our household level impact assessment service, click here.
The benefit cap and its impact
The lowering of the benefit cap in autumn 2016 has been planned by the current government with the specific intention of spreading the impact of the benefit cap more evenly across the country.
Originally introduced in Autumn 2013, the benefit cap limits the total amount of benefits that most people aged 16 – 64 can receive to £26,000 per annum. The cap will be lowered from £26,000 to £23,000 in London, and to £20,000 everywhere else.
This will see a more even distribution of the benefit cap’s impact, with roughly 4 in every 10 households nationwide having earnings below the new thresholds, as opposed to 1 in 2 households at the current level.
A House of Commons briefing paper published in March 2016 noted that 45% of households currently affected by the benefit cap live in London.
We find that whilst the lower cap will, as desired by the DWP, more evenly spread the impact across the country, the level of impact remains greatest in London. The benefit cap is still a London issue when we consider not just how the cap is spread, but where it hits hardest.
The current benefit cap; a London issue
Households in London are currently most heavily impacted by the benefit cap; an average of 1.16% of low-income working age households are currently affected by the benefit cap, compared to 0.63% in Big Cities, and only 0.32% in Small Cities and Towns.
A high working age population makes a council more likely to be impacted by the current benefit cap. London Boroughs have the highest working-age levels (73.6%), and other councils with similar rates are also disproportionately affected. In contrast, small Cities and Towns, which have the lowest working-age levels (60.5%), are least affected. The higher house prices in London are another key factor, as this increases the level of housing benefit received, taking more households over the cap.
New cap, more evenly spread
The DWP’s position is that the cap strengthens work incentives, and it therefore wants to lower the cap in order to reach more households outside of London. Indeed, under the new cap the spread of households affected will be almost even, with 3.2% of low-income households affected in Small Cities and Towns, 3.5% in London Boroughs, and 3.6% in Big Cities.
London Boroughs dealt with large numbers of households affected by the cap in 2013, and may feel better prepared this time around. However the introduction of the lower benefit cap in Autumn 2016 will have a very sudden impact on Large Citiies and Small Cities and Towns in particular.
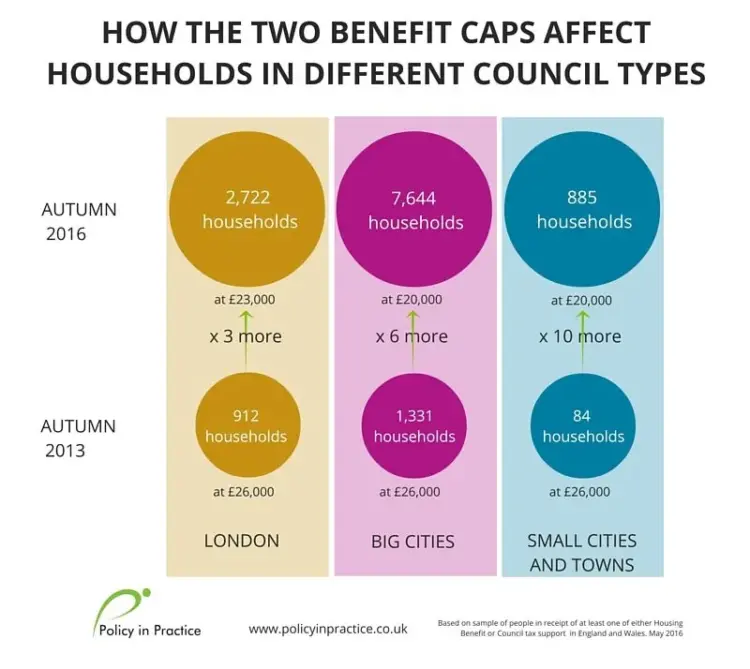
In London, where the cap limit will be set higher, the average number of households affected will increase by nearly 3 times and Big Cities will see nearly 6 times as many households affected, albeit from a high initial figure. However, nearly 10 times more households will be affected by the new cap in Small Cities and Towns. This figure is an average – it can go as high as 26 times more in one local authority (a leap from 8 households affected now to an estimated 204 affected once the new cap comes in).
Behind these average figures are individual households, each one of them with their housing now potentially at risk.
In a typical London cohort, an extra 2,722 households will be affected once the lower cap is introduced. For Big Cities, an average of 7,644 additional households will be affected and, in Small Cities and Towns, 885 new households will be affected.
It’s not just who is hit; but how hard they are hit
Whilst London will see the smallest increase in the number of households affected by the new benefit cap, the impact on individual households is most significant in the capital. Low income households in London will be an average of £13.49 a week worse off than under the old cap, compared to £12.25 in Small Cities only £3.75 in Big Cities.
Overall, a typical London household affected by the cap will lose £80.57 a week in benefits once the new cap comes in; over £20 more than the Big City (£59.04) and Small City (£59.15) averages.
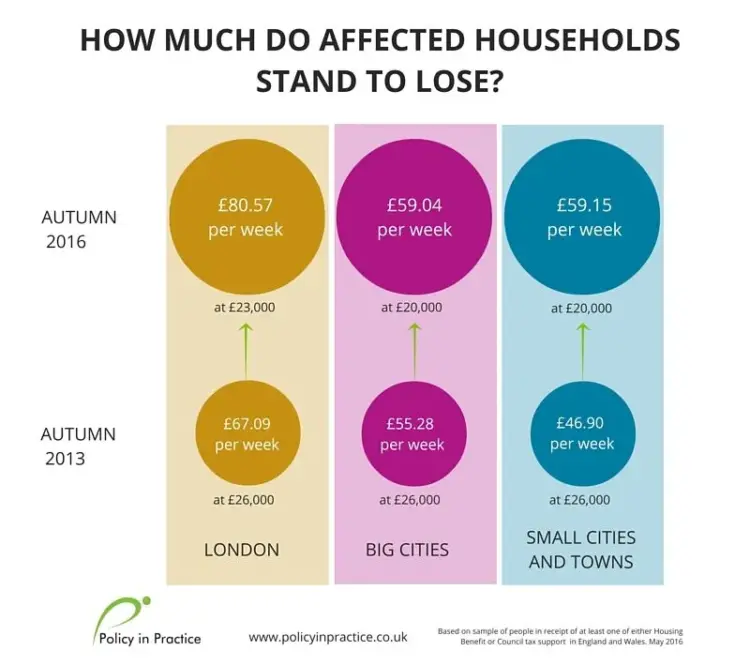
Whilst the households impacted by the new Benefit Cap are more evenly spread across the UK, the scale of impact remains highest, on average, in households in London.
When considering the impact of the benefit cap, it is important to weigh up the number of households affected, and the weight of the impact on each affected household. Ultimately, focusing support on the most heavily impacted households is likely to deliver the biggest bang for your buck, with limited resources.
Taking action
The scale of the benefit cap makes it hugely significant for local authorities, with each of these households affected having their home potentially at risk.
This has knock on consequences for housing teams, children’s services, and the teams administering support payments. When thinking about how to protect residents, aggregate figures are not enough.
Policy in Practice has been helping local authorities use their housing benefit data to pinpoint households at risk of the cap. Used in conjunction with DWP scan data, we have been able to identify households that should be exempt, and are able to track the effectiveness of support interventions over time.
Policy in Practice has led the way in mitigating against the impact of the benefit cap. Our first project led to the publication of the Benefit Cap White Paper in 2013, produced alongside Lewisham Council.
This described a three-step approach based on:
- Initial contact – identifying vulnerable households using SHBE data
- Engagement – face-to-face interviews using the Benefit Cap Calculator
- Ongoing support – developing individual support plans and signposting to service providers
Since then, we have helped local authorities to put these ideas into practice developed our approach, tailoring them to local circumstances. Download How Local Authorities Can Respond to the Benefit Cap eBook here.
Find out more
- Read the previous blogs in our National Picture of Welfare Reform series:
- Welfare Reform: comparing the impacts on London, big cities and small towns
- Universal Credit: the impact across London Boroughs, Big Cities and Small Cities and Towns
2. View the recording and slides from our recent webinar The Postcode Lottery of Welfare Reform: Are you hit the hardest? You will learn:
- How your local authority peers are impacted by welfare reforms (by council type)
- What impact the lower benefit cap, Universal Credit and housing reforms will have (by council type)
- How households in your local area are likely to be affected
In the final blog in our National Picture of Welfare Reform series we look in more detail at the Under-Occupation Charge (Bedroom Tax) and LHA Cap. To automatically receive our blog posts via email sign up in the box provided, to your right.


