Autumn statement 2023: Benefit households gain £5.65 a month but 30% more fall into negative budgets

Tylor-Maria Johnson Published on 12th December 2023

Rounding up our Autumn Statement 2023 analysis we model the combined impact of the policy measures announced on the lowest income households using administrative data for more than 116,000 households in receipt of benefits.
We find that the average working age household on Council Tax Support or Housing Benefit will be better off by only £5.65 per month and 30% more households, mostly single people and those out of work, will fall into negative budgets.
These findings follow our analysis of the changes to the benefits system that were announced in the Autumn Statement:
- Benefits will be uprated in line with CPI inflation of 6.7%
- Sanctions will be tightened whilst support for households with mental health illnesses and disabilities will be increased
- The Local Housing Allowance will be restored to the 30th percentile of local rents
As we move towards 2024 and the implementation of new policy we provide unique insight into how seemingly small policy shifts have an enormous impact for low income households, where £5 makes all the difference.
Finding 1: After costs, households on average will be £5 a month better off, despite benefits uprating
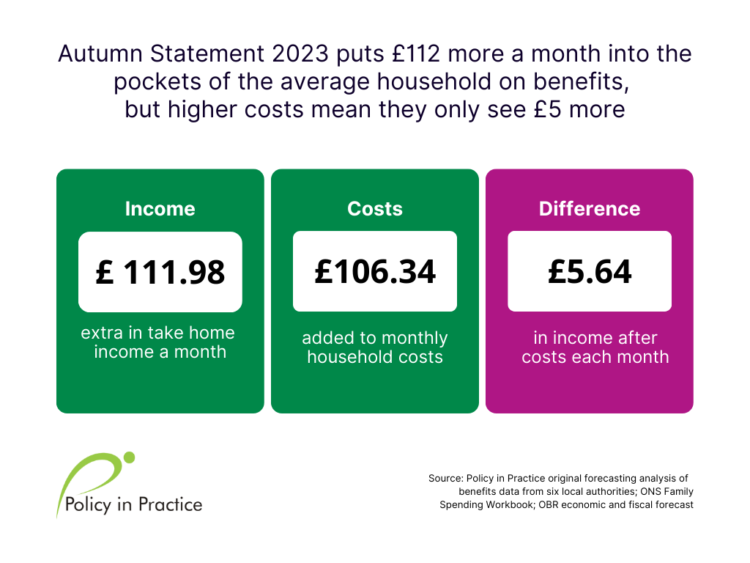
Compared to October 2023 we estimate that, from April 2024, the average household on means tested benefits will see:
- An average £111.98 a month increase in take home income
- An average rise of £106.34 a month increase in household costs
- A net increase in income of £5.65 a month after costs
Uprating and measures to increase the national living wage and lower national insurance will have a real impact on household take home income, but with average monthly costs increasing by a very similar amount, the average household will only see a £5.65 increase in disposable income.
Finding 2. The number of households facing a cash shortfall increases by 30%
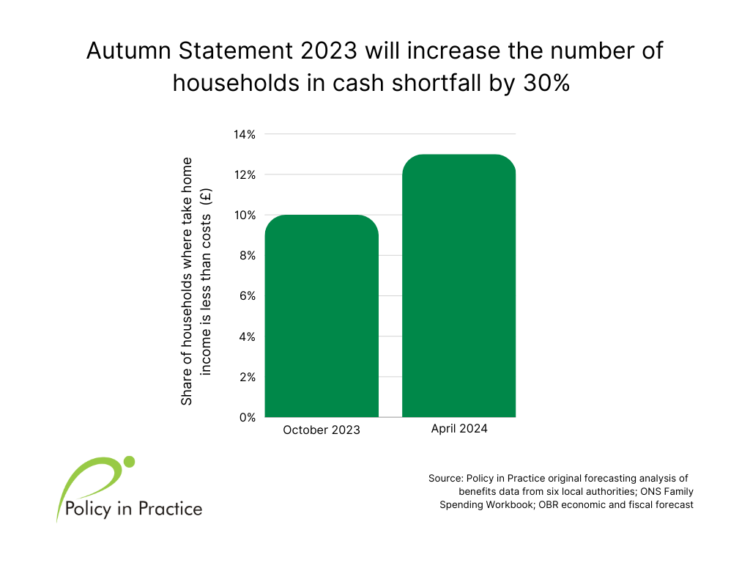
In October 2023 10% of households were facing a negative budget. This means that a household’s take home income is less than their estimated essential costs for items like food, water or clothing.
By April 2024 our forecast shows that the number of households facing a negative budget will grow from 10% to 13%. This is a 30% increase in the number of households who cannot afford their essential costs.
This contradicts the expected positive effects of the Autumn Statement’s improvements for households on means-tested benefits. The uprating of benefits in the statement represents the most substantial single increase in working-age benefit rates since 2010.
Together, the welfare policies from the Spring and Autumn Statements 2023 were designed to make employment pay, bringing over £104 billion into households, over about £3,700 per household on average.
But this analysis shows that for many households, costs will still grow at a slightly quicker rate than take home income.
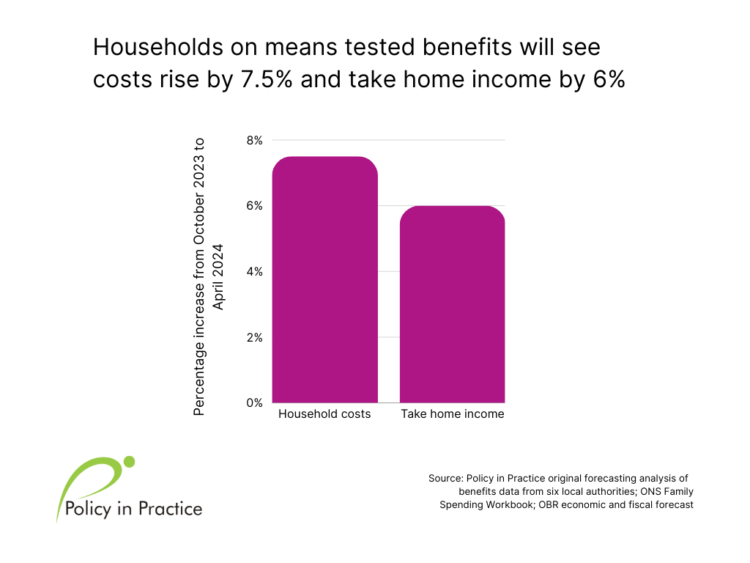
Figure 3 shows that compared to October 2023, costs from April 2024 are anticipated to grow by 7.5%, whereas take home income will grow by 6%.
Despite benefits being uprated by CPI inflation figures from September 2023, and at a higher rate than predicted leading up to the Autumn Statement, the legacy of low benefits uprating means that benefits have lost 8.8% of their real terms value compared to where they were in 2012.
As benefit levels become more divorced from the actual cost of living, proactive approaches to uprating benefits ought to be considered so that families on benefits have enough money to meet their essential costs.
Finding 3: Energy costs are not the main driver of rises in household costs
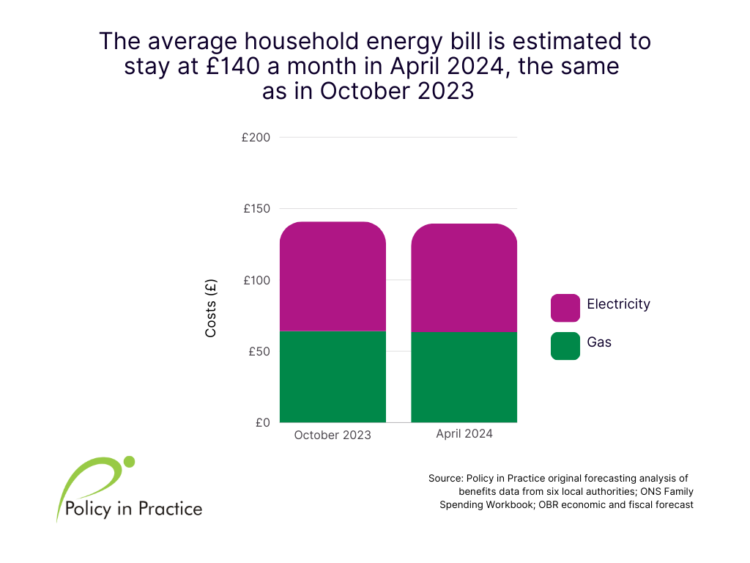
High energy prices have dominated much of 2023 and will remain high in 2024. These are the expected price caps from October 2023 until April 2024:
- October 2023 to January 2024: £1,931.25
- January 2024 to April 2024: £1,816.46
Despite these changes, our analysis finds that the average energy household bill from October 2023 to April 2024 will largely stay the same. The average household will continue to pay £140 per month on their energy bills, as they did in October 2023.
It is welcome news that the average household will not have to find more money to keep their heating on. However, energy bills are still higher than they used to be. Our previous analysis pointed out that household energy bills have increased by about 82% since 2021.
Combined with higher overall household costs, measures laid out in the Autumn Statement may not be enough to bridge the gap between increased prices and household incomes for people on means tested benefits.
Finding 4: Nearly a third more low income households are estimated to fall into negative budgets from April 2024
The rise in the number of households in negative budgets is driven by families who are living within tight budgets. Figure 5 shows the changes in the number of households in four different financial groups:
- Income after costs greater than £100+ (able to meet their costs)
- Income after costs is between £0 – £100 (getting by, but one broken appliance away)
- Income after costs is less than 0 (unable to meet their essential costs)
- Income less than rent (unable to meet their rent and their essential costs)
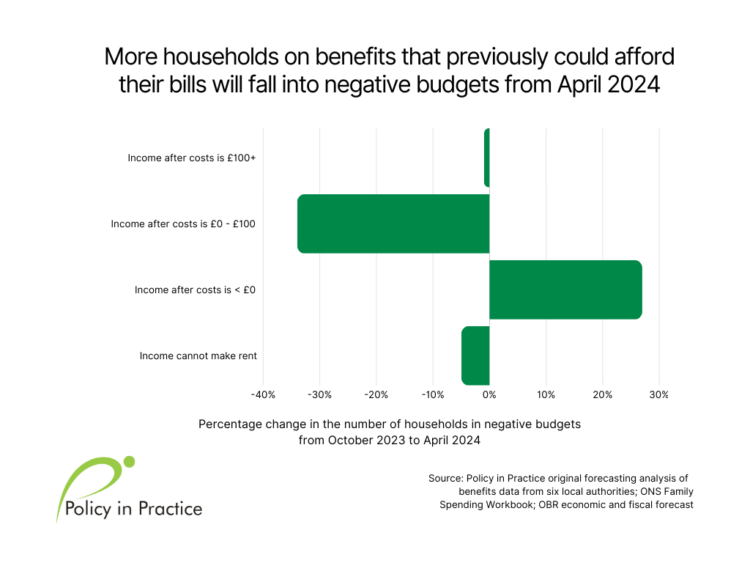
The chart shows that households that were once getting by are now finding that their costs have surpassed their income, completely eroding any remaining disposable income they would have had in October 2023.
These households are at risk of falling into debt and arrears and becoming more reliant on additional support to help meet their essential costs.
There is also a 5% fall in the number of households whose income is less than their rent, primarily because of the increase in the Local Housing Allowance.
Households are, on average, receiving more housing support and are more likely to have enough to cover rental costs, however, more must be done to increase a household’s overall financial resilience to afford the rest of their costs.
In the same way that the LHA was restored to reflect local rents, the standard allowance should also be increased to reflect actual household costs for food, bills, and day to day activities.
Finding 5: Single households are the most likely of all household types to fall into negative budgets from April 2024
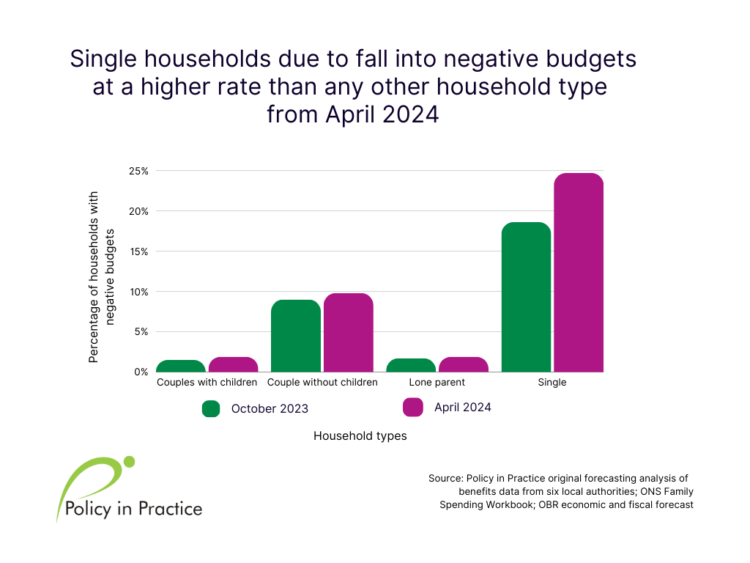
Figure 6 shows that single households are most likely of all household types to be in negative budgets in both October 2023 and April 2024. We estimate that, from April 2024, there will be a 34% increase in the percentage of singles with negative budgets, growing from 19% in October to 25% in April 2024.
This is likely to be because single households only have one income to rely on to pay their bills and they do not get additional elements in their benefits award due to having children. Single households are also limited to lower housing support, with those under 35 being limited to the lowest LHA rate, calculated based on multiple people sharing accommodation.
Although lone parents and couples with children are not as likely to be in negative budgets as singles, we estimate that they will also see relatively large percentage increases in the number of those in cash shortfall. Couples with children see their rate of being in a negative budget increase by 24% growing from 1.5% to 2% in April 2024.
More must be done to help households on the lowest incomes to meet their basic costs
The Autumn Statement 2023 delivered a few welcome changes to social security that will increase households’ capacity to meet their rent and cover more of their essential costs.
Unfreezing the Local Housing Allowance, increasing benefit rates by September’s CPI inflation and investing in Universal Support and other programmes offer some respite to households on the lowest incomes.
But we believe that, after the cuts over the last decade and the cost of living pressures facing households, welfare reforms need to go further.
Costs will continue to outpace the value of benefits in April 2024. The risk of being in a negative budget will increase by about 30%, leaving many more households in need of support to make ends meet.